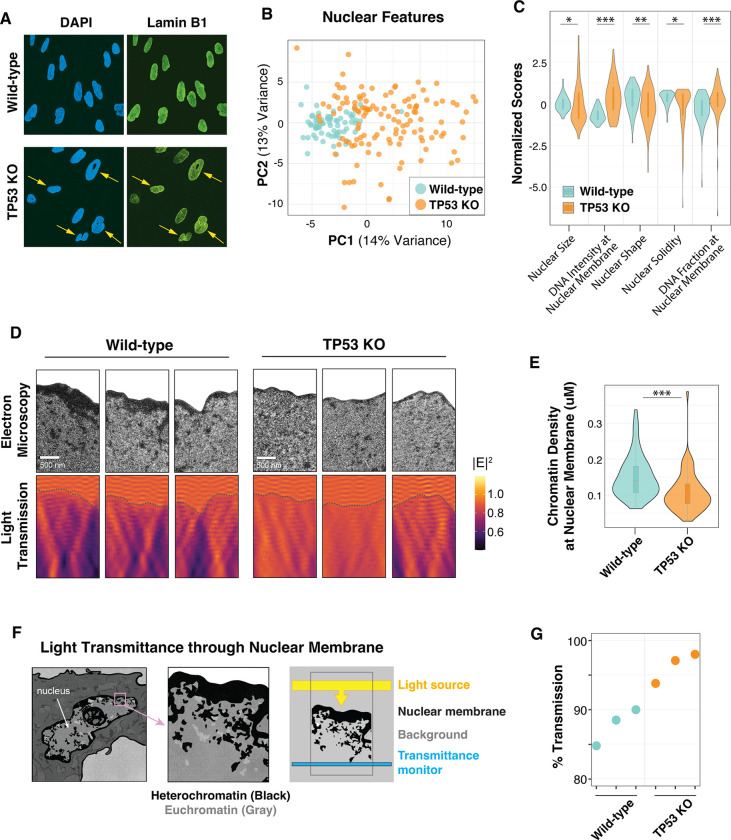
Fig. 4. The nuclear membrane of TP53 KO cells exhibits altered morphology and increased light transmission.
(A) Representative images of lamin B1 and DAPI staining from confluent cells. (B) Principal Component Analysis (PCA) of CellProfiler nuclear features that predict wild-type (n=71) and TP53 KO (n=125) cell morphology. (C) Representative z-scaled scores for select nuclear features used in the PCA plot in (B). Mann-Whitney U test indicates: * for <0.05; ** for <0.01; *** for <0.001 p-value (D) (Top panels) Transmission electron microscopy (TEM) images with the cytoplasm cropped to highlight the nuclear membrane. (Bottom panels) Finite-difference time-domain simulations of light transmission (described in F) for TEM images in top panels. Heatmap indicates the electric field (E2). (E) Nuclear membrane density measurements of TEM images (n=70) for each cell line. Two sample t-test was indicates: * for <0.05; ** for <0.01; *** for <0.001 p-value. (F) Schematic of finite-difference time-domain light transmission simulations using TEM images. Artwork credit to Ana Kimber. (G) Measurements of simulated 306 nm UVB light transmission in bottom panels of (D). t-test indicates p < 0.05 significance between cell types.

