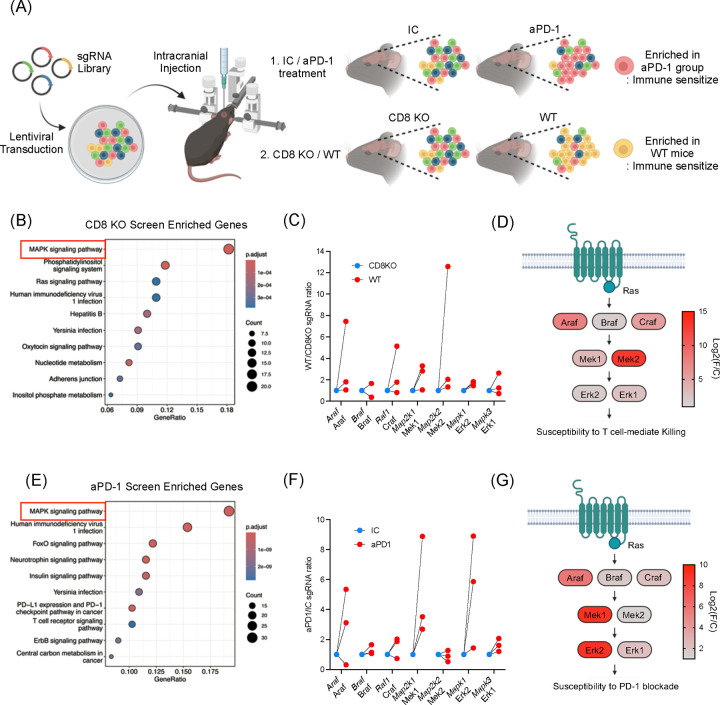
Figure 1. In vivo kinome-wide CRISPR/Cas9 screens identify MAPK/ERK signaling as a regulator for susceptibility to CD8+ T cells and anti-PD-1 immunotherapy.
(A) Schematic illustration of in vivo CRISPR/Cas9 screening. SgRNA library transduced to GL261 mouse glioma cells and the cells were injected intracranially. Comparisons were 1) IC (n = 11) vs. aPD-1 (n = 12), 2) wildtype (n = 12) vs. Cd8 KO mice (n = 20). (B) Gene enrichment analysis from the CRISPR/Cas9 screenings comparing wildtype and Cd8 KO mice. (C) Fold changes of sgRNAs targeting MAPK/ERK pathway genes. Comparing wildtype and Cd8 KO mice, 3 sgRNAs are depicted. (D) Detailed diagrams of the MAPK signaling cascade, indicating log fold changes in sgRNA enrichment. Log2(foldchange) was calculated based on the top performing sgRNA depleted in Cd8 KO mice. (E) Gene enrichment analysis from CRISPR/Cas9 screening comparing mice received IC and aPD-1. (F) Fold changes of sgRNAs targeting MAPK/ERK pathway genes. Comparing IC and aPD-1 group, 3 sgRNAs are depicted. (G) Diagrams of the MAPK signaling cascade, indicating log fold changes in sgRNA enrichment. Log2(foldchange) was calculated based on the top performing sgRNA enriched in aPD1 treated group. For B and E, the gene list of the kinome was used as background (denominator) to calculate the gene ontology enrichment.

