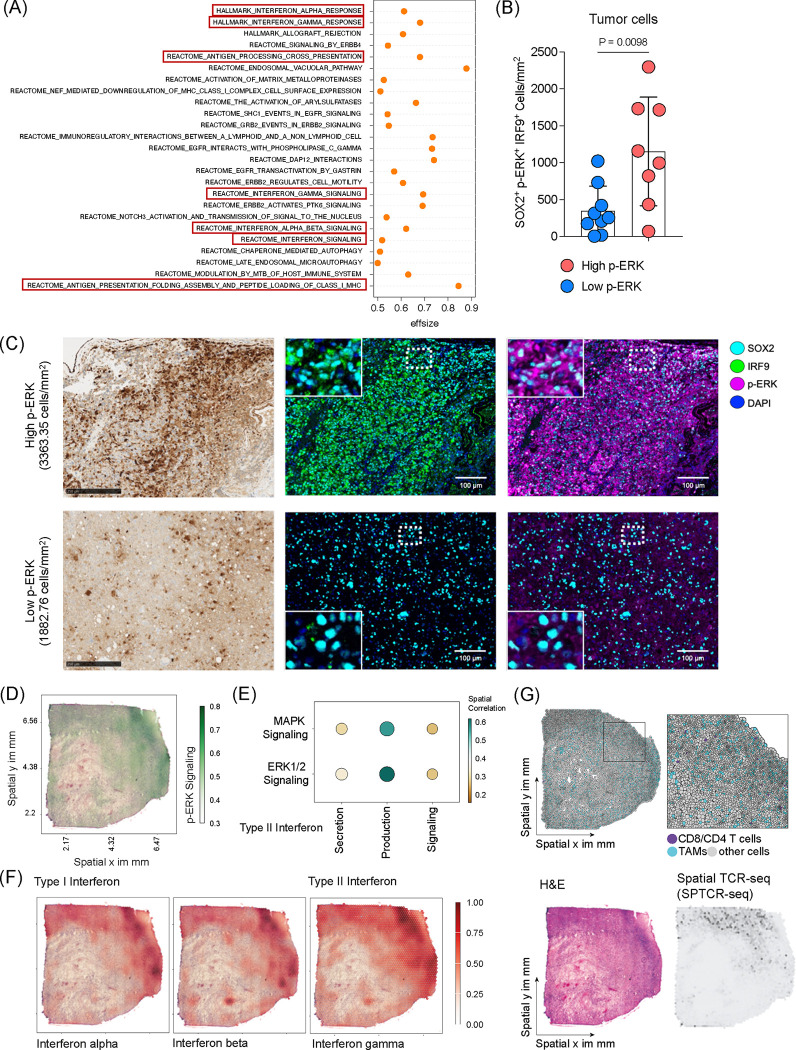
Figure 4. MAPK/ERK pathway is associated with interferon signaling in GB.
(A) Differentially expressed gene signatures of tumor cells from single cell RNA sequencing comparing high and low p-ERK GB tumors. (B) Quantification analysis of immunofluorescence analysis representing SOX2+p-ERK+IRF9+ cell density in high p-ERK (n = 8) and low p-ERK (n = 9) tumors. Unpaired two-tailed T test was used, and P-value is depicted. (C) Representative immunohistochemistry (IHC) and immunofluorescence (IF) images of high p-ERK and low p-ERK GB patients depicting p-ERK and IRF9 expression. Scale bar = 250 μm for IHC and 100 μm for IF. (D) Example image of spatial multi-omic analysis of GB tumor representing p-ERK signaling activity. (E) Spatial correlation analysis of GB tumors showing correlation between MAPK and ERK1/2 signaling and type II IFN signatures. (F) Representative images of spatial muli-omic analysis demonstrate Type I and II interferon responses in GB tumor. (G) Single-cell composition after deconvolution representing the location of T cells and TAMs (upper). H&E image demonstrates the histology of GB tumor, and the image of spatial T cell receptor sequencing shows infiltrating T cells in GB tumor (low).

