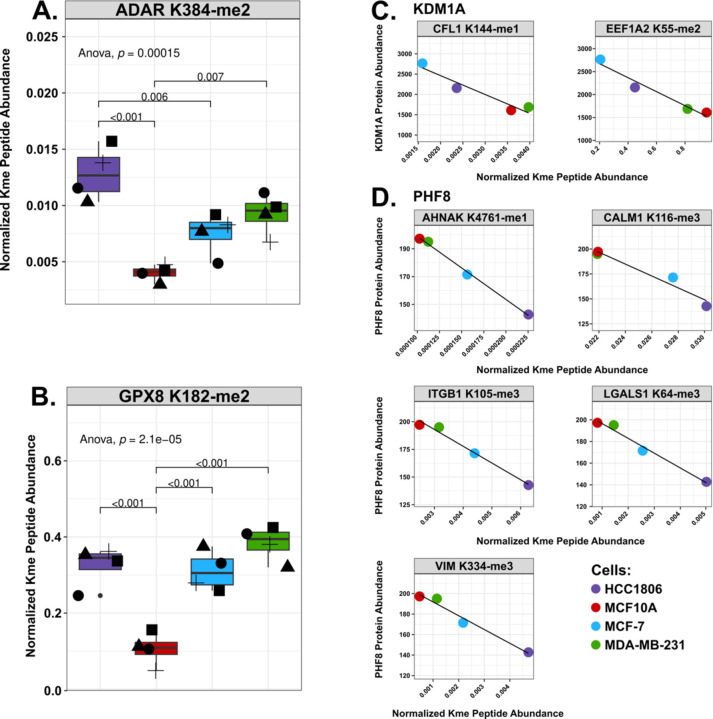
Figure 5: Comparison of normalized Kme site abundances and correlation with KDM levels.
A. Boxplots of the normalized Kme site abundances (y-axis) of ADAR K384-me2 and GPX8 K128-me2 in HCC1806 (purple), MCF10A (red), MCF-7 (red), and MDA-MB-231 (green). Shapes represent different biological replicates. B. Correlation between the protein abundance for indicated KDMs (KDM1A or PHF8) and normalized Kme peptide abundance as indicated (gray box).

