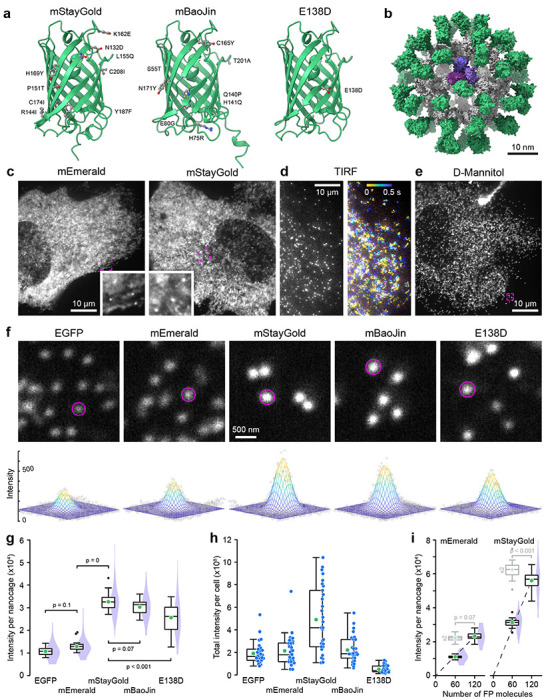
Figure 1. Comparison of FP-tagged I3-01 nanocage fluorescence intensity.

(a) AlphaFold2 structures of the three monomeric mStayGold variants viewed from the dimerization interface. Amino acid substitutions compared to the original StayGold dimer are highlighted. (b) AlphaFold2 model of an mEmerald nanocage. The I3-01 peptides are grey with one trimer highlighted in shades of purple. (c) Spinning disk confocal images of mEmerald and mStayGold nanocage-expressing RPE cells at 500 ms exposure times. Insets show indicated regions at higher magnification highlighting immobile nanocages. (d) mStayGold nanocages in TIRF microscopy at 10 ms exposure times. The right panel shows a color-coded projection over 500 ms showing diffusion over this time period. (e) mStayGold nanocages by spinning disk confocal microscopy in a 400 mOsm D-Mannitol-treated RPE cell. The indicated region is shown at higher magnification in the middle panel below. (f) Comparable peripheral cell regions of D-Mannitol-treated RPE cells expressing the indicated FP nanocage fusions. Circles indicate areas within a two standard deviation radius as determined by 2D Gaussian fit. Bottom panels show the Gaussian fit for these example nanocage particles. (g) Comparison of the integrated brightness of nanocage particles tagged with the indicated FP. n = 30 cells each from 3 independent experiments. Statistical analysis by ANOVA with Tukey-Kramer HSD. (h) Total integrated intensity per cell of the same cell population as in (g). (i) Comparison of the integrated brightness of mEmerald and mStayGold nanocages containing either 60 or 120 FP molecules. The dashed lines are linear regressions through the origin. Box plots in light grey are the 60 FP molecule nanocage intensity data multiplied by two indicating the expected distribution if the 120 FP molecule nanocages were exactly twice as bright. Statistical comparison of these expected distributions to the 120 FP molecule nanocage intensities by Student’s t-test. n = 20 cells per condition. In (c), (e) and (f) all spinning disk confocal images were acquired with the same exposure settings and images are scaled to the same absolute intensities. In (g) - (i) green circles indicate the mean. Violin plots show the intensity distribution of all nanocage particles with 10 nanocages analyzed per cell.
