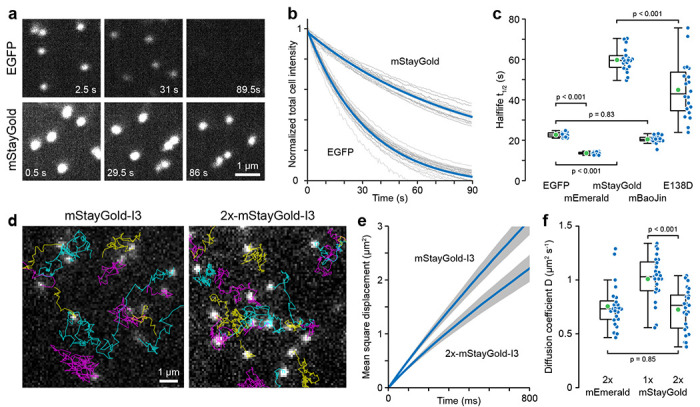
Figure 2. Comparison of FP-tagged I3-01 nanocage photostability and intracellular diffusion.

(a) Representative EGFP and mStayGold nanocage photobleaching images. Images are scaled to the same absolute intensities. (b) Photobleaching as a function of light exposure. Grey curves are measurements from individual cells normalized to the fluorescence intensity at the beginning of the time series. Blue curves are single exponential fits. (c) Comparison of photobleaching half-life. n = 20 cells per condition. Statistical analysis by ANOVA with Tukey-Kramer HSD. (d) Representative TIRF microscopy images from 85 frames per second time series to measure nanocage diffusion. Particle tracks are overlaid in color. (e) Average mean square displacement curves from 25 cells per condition representing a total of 16504 mStayGold and 20692 2x-mStayGold nanocage particle tracks. Grey areas indicate 95% confidence intervals. (f) Comparison of the diffusion coefficients of the indicated nanocage constructs. n = 25 cells per condition. Statistical analysis by ANOVA with Tukey-Kramer HSD.
