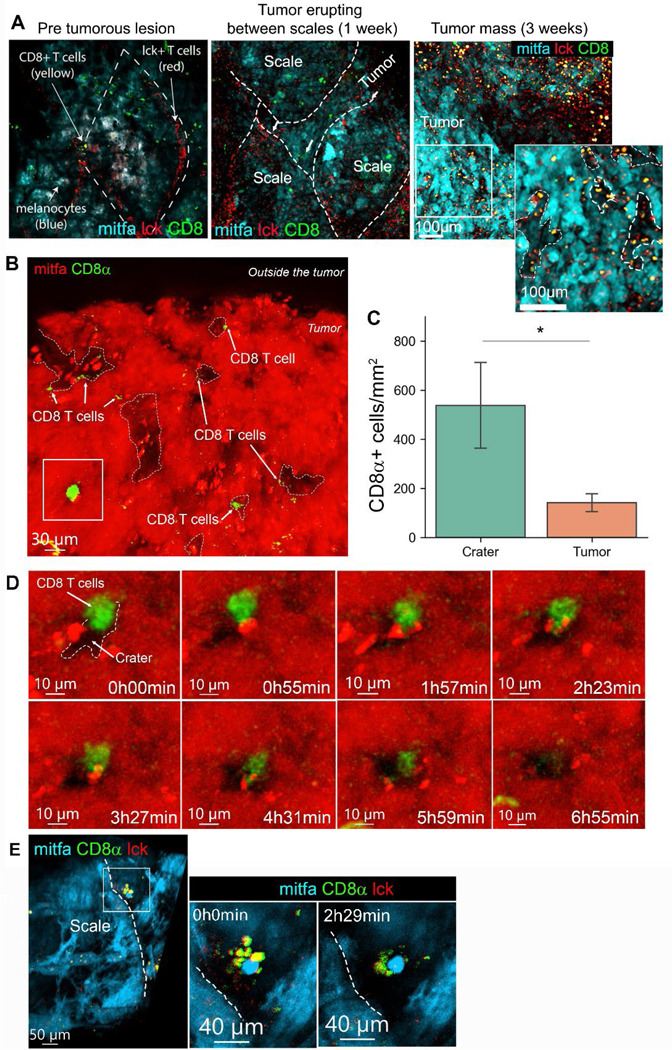
Figure 1. CD8+ T cells are preferentially retained in craters, interacting with tumor cells.

(A) Longitudinal imaging of a mitfa:BFP tumor across stages of development in a (cd8a:EGFP;lck:mCherry) transgenic fish. Left: Radial growth of melanoma below the scale. T cell skin distribution remains normal. Middle: Same tumor after one week. Slightly protruding melanoma and the tessellated T cell structure is disrupted. Right: Same tumor after three weeks from initial imaging. A protruding tumor, where CD8+ T cells infiltration is evident. Enlarged- CD8+ T cells are found in areas of low mitfa expression (marked by dashed white lines). (B) 3D projection of a melanoma tumor surface in a cd8α:EGFP transgenic zebrafish (representative of over 200 tumors imaged in this study). Arrows mark CD8+ T cells, which are found in mitfa:mCherry devoid pockets, i.e. craters. (C) CD8+ cell density (cells per mm2) in crater vs. tumor area (n=5 fish. Data is mean±SE, Mann Witney U test, *p value=0.015). (D) Snapshots from time lapse imaging of the area marked by the rectangle in (B). Time is hours:minutes. A CD8+ cell interacting with a melanoma cell over a crater, then enters the crater after 6 hours. (E) Snapshots from time lapse imaging of a scale edge crater, show multiple CD8+/lck+ T cells interacting with a melanoma cell in a crater. Dashed line marks the edge of the scale. Time is hours:minutes.
