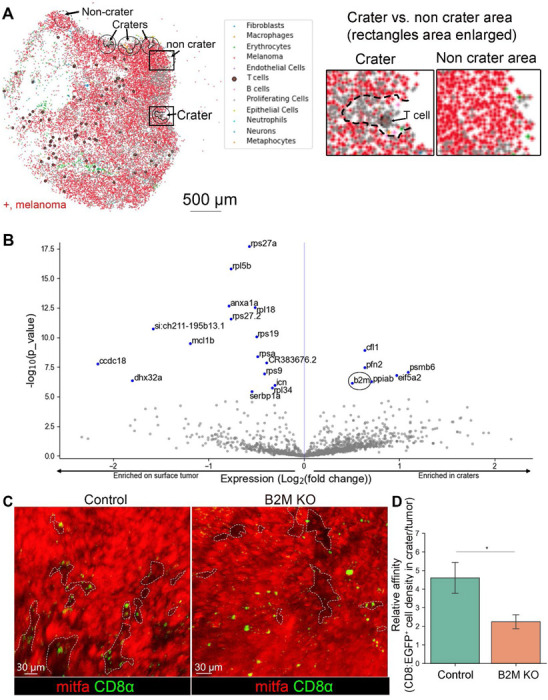
Figure 2. Craters are sites of elevated B2M expression which retains CD8+ T cells in them.

(A) Left: Slide-seq gene expression map of zebrafish melanoma tumor depicting an array of cells including CD8+ T cells (large purple circle) and mitfa+ melanoma (red). Crater areas are circled in black, non-crater areas are circled in dashed black line. Right: enlarged view of the crater and non-crater areas marked by rectangles in the image on the left. (B) Volcano plot identifying differential gene expression in crater vs. non-crater associated tumor cell. B2M is circled. (C) 3D live imaging of control(intact) vs. B2M depleted mitfa:BFP tumors grown in (cd8α:EGFP/lck:mCherry) zebrafish (Mitfa color switched by Imaris to red for better visualization). Craters are marked with dashed lines. (D) The relative affinity of CD8+ T cells to craters, i.e CD8+ cell density in craters/non crater tumor surface, in control, intact B2M-and melanoma specific B2M-depleted tumors. (n=4 control, n=6 B2M CRISPR ablated. All CRISPR sequenced to verify mutation. Data is mean±SE, T test. *=p-value 0.02).
