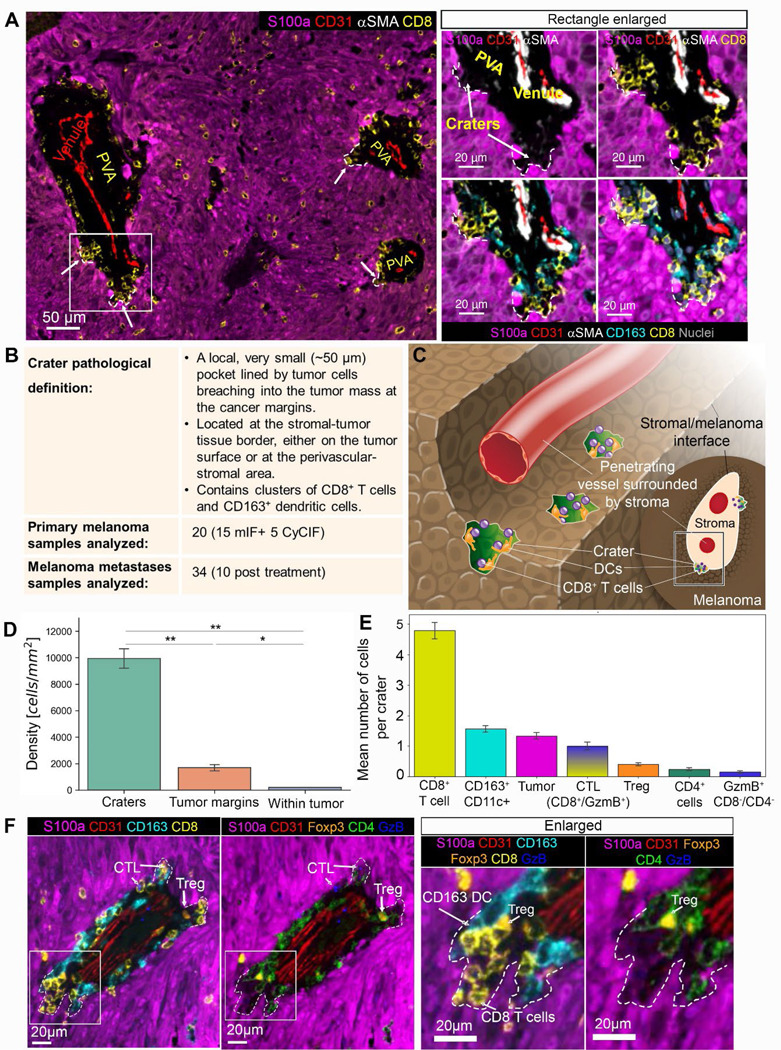
Figure 5. Craters are found in human melanoma, breaching from the tumor margins.

(A) Left: low magnification of a representative human primary nodular melanoma (CyCIF). Craters are marked by arrows and white dashed lines. Right: the area marked by the rectangle in the left image is enlarged, showing CD8+ T cells and CD163+ DCs packed together within craters (marked by arrows and white dashed lines). (B) A table summarizing the craters features and samples used in this study. (C) a graphical illustration of craters (colored green) breaching from a perivascular space into the melanoma tumor. The content of the perivascular area was omitted for clear view of the craters. (D) CD8+ T cell density in craters, tumor margins and embedded in the S100a+ tumor mass (within tumor). (n=2 tumors. Data is mean± SE, T-Test, ** p value= crater/border=0.008, crater/tumor=0.005, *p value=0.023). (E) Cellular composition of craters showing mean number of cells per crater for each cell type (n=714 craters, Mean± SE). (F) A representative crater image, showing the location of CD8+ T cells, CD163+ DCs, CD4+ cells, CD4+/FOXP3+ T regulatory cells, and CD8+/GzmB+ cytotoxic T cells at the crater area. Abbreviations: CTL=cytotoxic T cells, Treg=T regulatory cells, GzmB= granzyme B. DCs= CD11c+ dendritic cells.
