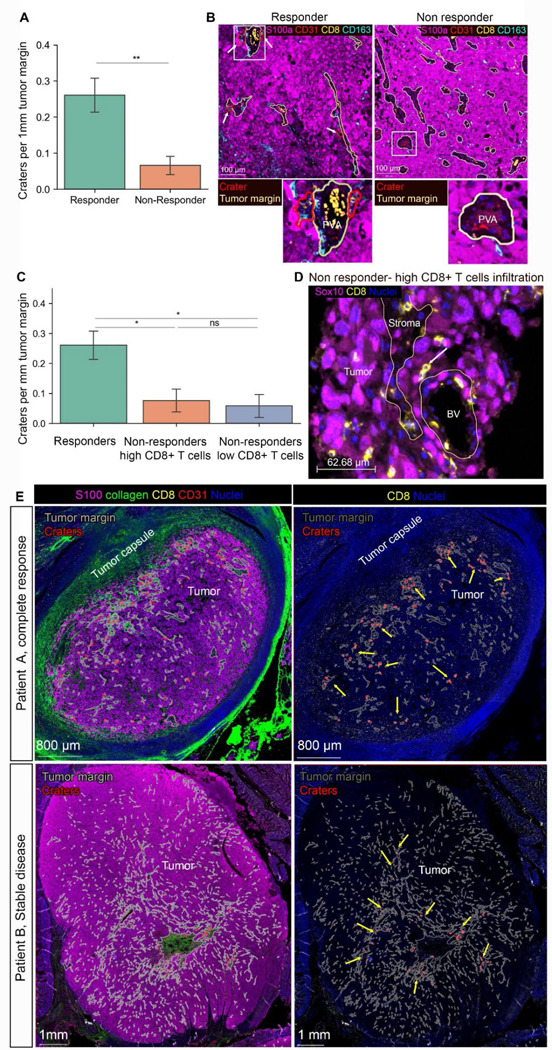
Figure 7. CD8+ T cells accumulation in craters and crater density within tumors mark successful ICB therapy response.

(A) number of craters per 1mm tumor margin (which is the stromal-tumor interface) in samples of patients post ICB treatment (n= 3 responders -stable disease and complete remission, 7 non responders (progressive disease). Mean ±SE, TTest. *P value= 0.004). (B) representative images of multiplex images of a responder vs. non responder (lowly infiltrated). Peri-vascular areas are circled by yellow lines and craters are circled by red lines. Rectangle areas in the low magnification images are enlarged below each image. (C) Non responders were divided into highly infiltrated and lowly infiltrated samples (see Figure S13A for CD8+ infiltration levels, materials and methods for threshold determination). Graph showing number of craters per 1mm tumor margin in responders, non-responders with high CD8+ T cells infiltration and non-responders with low CD8+ T cells infiltration. (n= 3 responders, 3 non responders with high CD8+ T cells infiltration, 4 non responders with CD8+ T cells low infiltration. mean ±SE, TTest. P values: **= 0.0038, *=0.019). ns=0.13). (D) representative image of melanoma in a highly infiltrated sample taken from a non-responding patient. The tumor margin is marked with yellow lines. While many CD8+ T cells are evident, they infiltrate the tumor as single cells or doublets (white arrow) and very few, if any, craters are found. (E) Two samples of patients who responded to ICB in the adjuvant setting, showing regionality of crater formation within the tumor mass. Tumor margins (stromal/tumor border) are marked with grey lines. Craters are marked with red lines. Yellow arrows indicate foci of craters within the tumor mass. Patient A had a complete response and has foci of craters near the tumor border. Patient B had stable disease and had foci of craters at the middle of the tumor mass, near a large stromal area.
