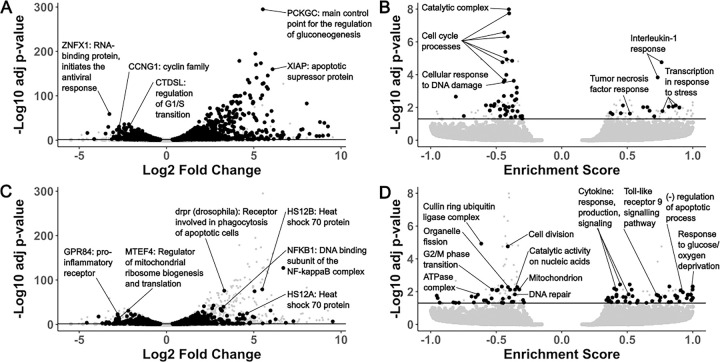
Figure 4. Top differentially expressed genes and pathways in MarBTN after exposure to seawater.
Volcano plots of fold change and significance of differentially expressed genes (A/C) and gene sets (B/D) in ASW-treated MarBTN (n=3) versus untreated MarBTN (n=3). Genes of note are labeled with annotations and abbreviated descriptions. Volcano plots are filtered for genes/sets that are (A/B) or are not (C/D) differentially expressed in ASW-treated hemocytes (n=3) versus untreated hemocytes (n=3). For comparison, the reciprocal comparison is included in small grey points on each plot. Line marks false discovery rate adjusted significance threshold (p < 0.05), with genes below threshold colored in grey.

