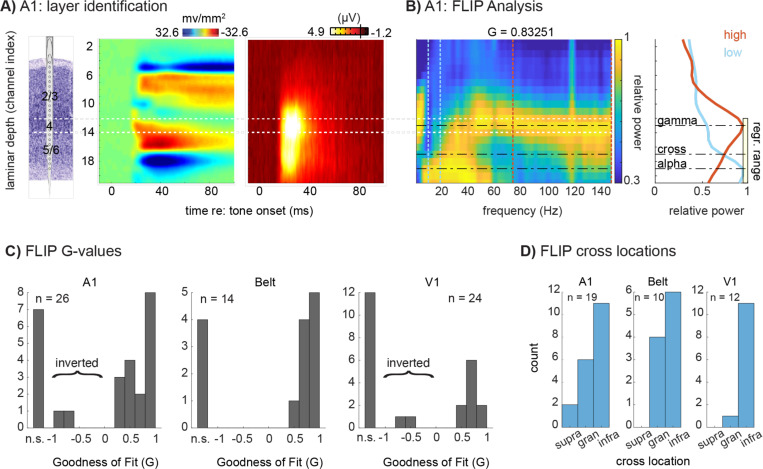
Fig 1 –
Frequency-based Layer Identification Procedure (FLIP) analysis in auditory and visual cortices. A) Representative tone-evoked CSD and MUA profiles used to identify cortical layers in A1; Layer 4 is outlined in white. Laminar identification used methods established by prior studies. Specifically, the electrode array was positioned to straddle the region exhibiting significant (non-overlapping trial-wise confidence intervals between the pre- and post-stimulus periods) CSD activation. Layer 4’s location was defined as the channel in the middle third portion of the active region with the earliest current sink onset, within 100 microns (+/− 1 channel in this case) of the peak amplitude MUA site. B) Relative LFP power at each frequency, epoched −300 to 300 ms around stimulus onset, displayed as a color plot (left) with the associated goodness of fit (G) value generated by the FLIP algorithm; line plots (right) depict the laminar power gradients for alpha-beta (blue line, 10–20 Hz) and broadband gamma (red line; 75 – 150 Hz). The dashed lines indicate low and high frequency peaks picked by FLIP, and the power gradient crossing point. The yellow box indicates the FLIP-selected range of channels over which it conducts the regression. C) Goodness of fit (G-values) resulting from FLIP for A1, Belt, and V1. Values could be not significant (“n.s.”), negative (inverted motif), or positive. D) FLIP-defined power gradient crossing locations for the subset of sites with significant fits by FLIP, for A1, Belt cortex, and V1, binned into CSD/MUA-defined supragranular, granular, or infragranular compartments.

