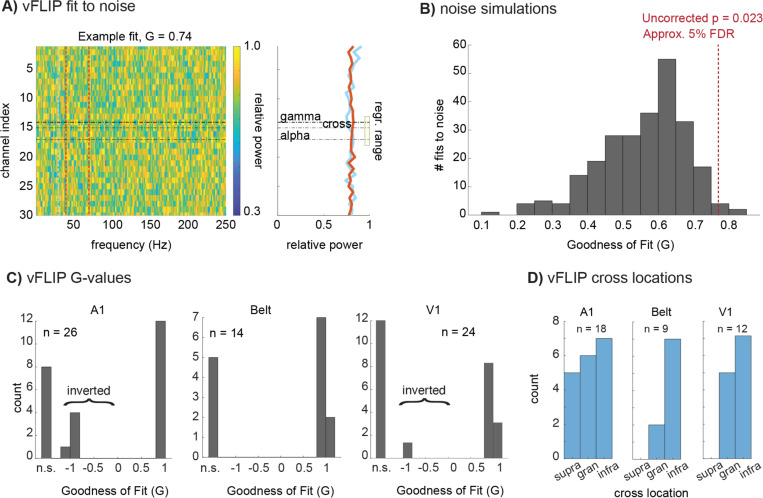
Figure 2 –
Variable Frequency-based Layer Identification Procedure (vFLIP) analysis. A) Representative relative power map of 1/f noise samples (30 channels, 1000 time points, 75 trials) displayed as a color plot (left) with the associated goodness of fit (G) value from vFLIP, 0.74. B) A histogram depicts the G-values produced by vFLIP when fit to 1/f noise 250 times. A red line depicts the statistical threshold used to attain a 5% False-discovery rate, which was then applied to the vFLIP results in auditory and visual cortices. C) as in Fig. 1, vFLIP cross locations determined by co-registration with CSD and MUA profiles for areas A1, Belt auditory cortex, and V1, and binned into supragranular, granular, or infragranular compartments. D) as in Fig. 1, G-values for A1, Belt, and V1, which could be not significant (“n.s.”), negative (inverted motif), or positive.

