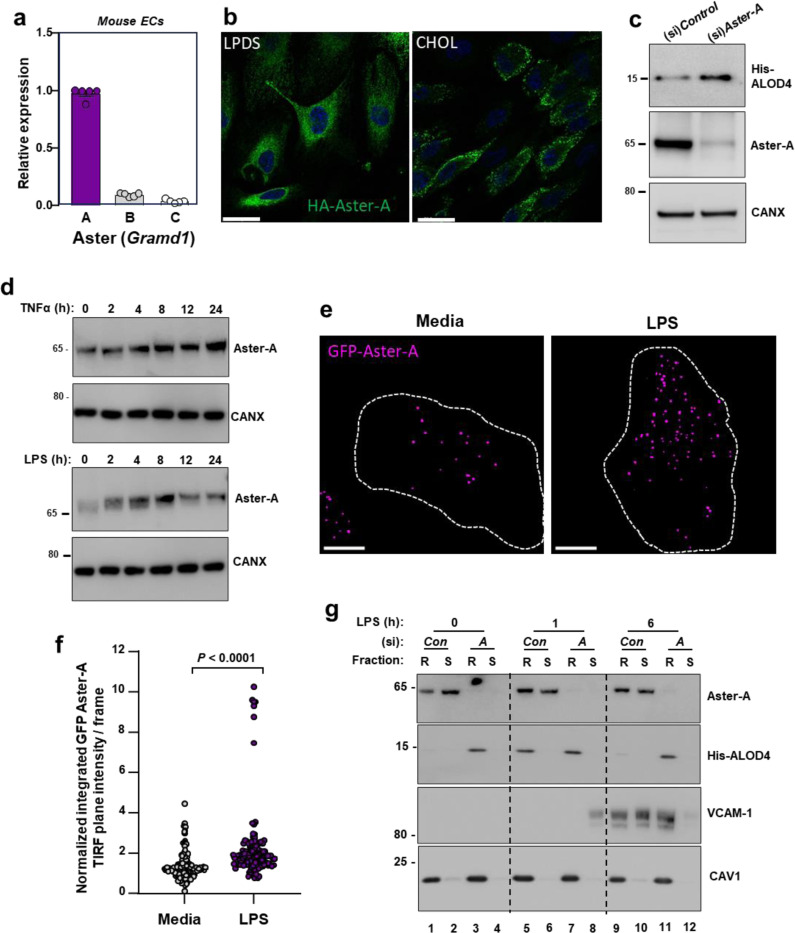
Fig. 4. Aster-A regulates accessible cholesterol in ECs after activation.
(a) Gramd1a (Aster-A), Gramd1b (Aster-B) and Gramd1c (Aster-C) expression relative to 36b4 in primary mouse hepatic ECs. (b) Confocal microscopy of HAECs stably expressing HA-Aster-A and cultured in LPDS or LPDS with MβCD-cholesterol (100 μM) for 1 h. Scale bar, 23 μm. (c) His-ALOD4 binding to the surface of HAECs treated with (si)Control or (si)Aster-A and cultured in 10% FBS. (d) Endogenous Aster-A protein levels in HUVECs exposed to TNFα (10 ng/ml; top) or LPS (100 ng/ml; bottom) for the indicated times. (e) TIRF microscopy of HAECs stably expressing EGFP-Aster-A and cultured in fresh complete medium (10% FBS) or fresh complete medium plus LPS (100 ng/ml) for 60 mins. Pseudo-colored dots indicate GFP-Aster-A intensity in the TIRF plane (within 100 nm of the PM). Dashed lines indicate cell boundaries. Scale 10 μm. (f) Quantification of GFP-Aster-A in the TIRF plane +/− LPS. Values represent normalized integrated intensities at 40 −70 min after changing to fresh media +/− LPS. Control n = 154 frames from 52 cells, LPS n = 140 frames from 53 cells from two independent experiments. (g) Western blots of HUVECs treated with (si)Control or (si)Aster-A and exposed to LPS for the indicated times before incubation with ALOD4. Cells were subsequently fractionated into Trition-X100 detergent soluble or detergent resistant domains. Data are represented as mean ± SEM.

