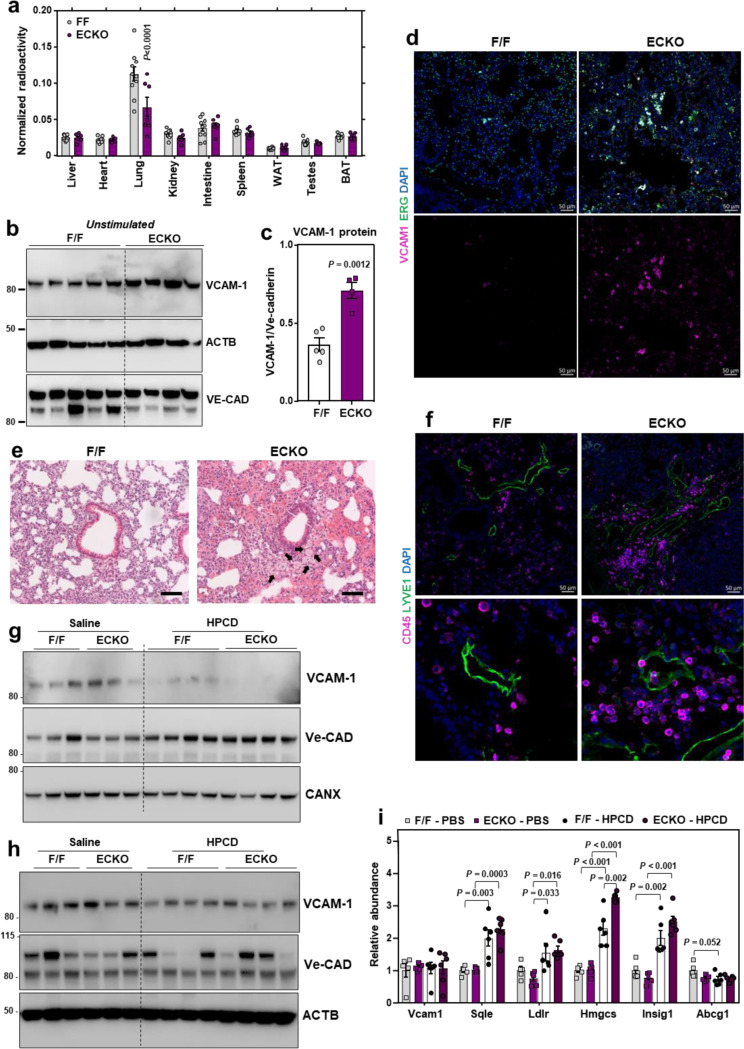
Fig. 6. HPCD infusions lower VCAM-1 in response to LPS in vivo.
(a) Tissue [3H]-cholesterol radioactivity normalized to tissue weight in male F/F and ECKO mice 72 h after i.v. administration of [3H]-cholesterol-HDL. Samples analyzed by two-way ANOVA with genotype and tissue as independent variables. P tissue < 0.0001; P genotype < 0.0061; P interaction < 0.0001. n = 10 F/F and 7 ECKO. (b) Western blots for VCAM-1 in the lungs of female F/F and ECKO mice 1 year after Cre induction. n = 5 F/F and 4 ECKO. (c) Quantification of VCAM-1 relative to Ve-cadherin measured by western blot as shown in Fig. 7B. (d) Immunofluorescence microscopy of VCAM-1 (pink), ERG (green) and DAPI (blue) in the lungs of female F/F and ECKO mice 3 weeks after Cre induction. Scale bar, 50 μm. (e) H & E staining in the lungs of female F/F and ECKO mice 3 weeks after Cre induction. Arrows indicate immune cells around vessels. Scale bar, 100 μm. (f) CD45-positive immune cells (purple) co-stained with the lymphatic vessel marker LYVE1 (green) and DAPI (blue) in the lungs of female F/F and ECKO mice 3 weeks after Cre induction. Scale bar, 50 μm. (g and h) VCAM-1 in the hearts and lungs of male F/F and ECKO mice injected with LPS for 20 mins before receiving i.v infusions of saline or HPCD. Tissues were collected 3 h after LPS injections. n = 5 F/F + saline, 5 ECKO + saline, 6 F/F + HPCD and 6 ECKO + saline. (i) qPCR in the lungs of male F/F and ECKO mice injected with LPS for 20 mins before receiving i.v infusions of saline or HPCD. Tissues were collected 3 h after LPS injections. n = 5 F/F + saline, 5 ECKO + saline, 6 F/F + HPCD and 6 ECKO + saline. Data are represented as mean ± SEM with individual mice noted as dots.

