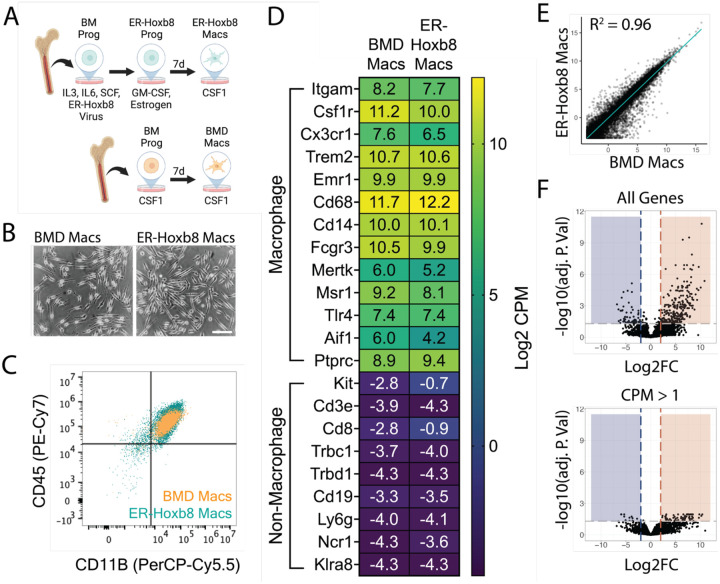
Figure 1: Comparison of ER-Hoxb8 to BMD macrophages in vitro.
(A) Schematic for creation of bone marrow-derived (BMD) and ER-Hoxb8 cells (B) Brightfield images of BMD and ER-Hoxb8 macrophages plated in the presence of 30ng/mL mouse CSF1 and differentiated for seven days (scale bar = 100um) (C) Dot plot representing CD45/CD11B levels (pre-gated on live, singlet, leukocyte) by flow cytometry (D) Heatmap showing Log2 CPM of canonical macrophage (top) and non-macrophage (bottom) immune cell genes (E) Whole transcriptome comparison between BMD and ER-Hoxb8 macrophages, depicting best fit line and coefficient of determination (one dot = one gene) (F) Volcano plots comparing all genes or those with CPM > 1 (Log2FC >= 2, FDR < 0.05); blue = upregulated in ER-Hoxb8 macrophages, red = upregulated in BMD macrophages

