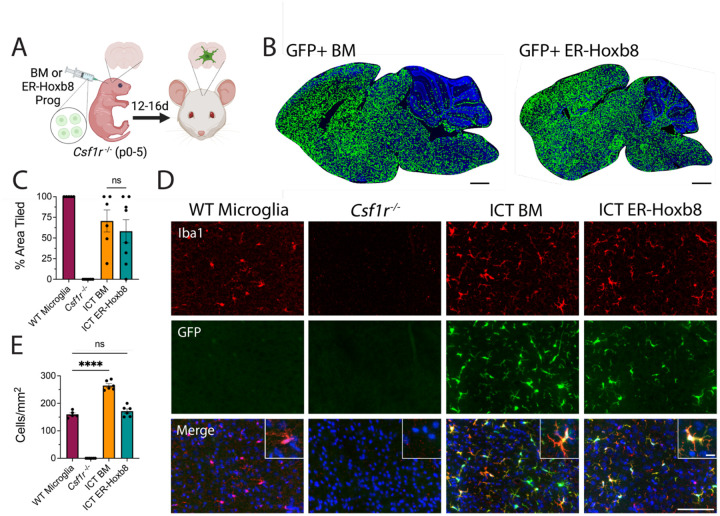
Figure 2: Engraftment potential of ER-Hoxb8 compared to BMD macrophages after intracranial transplantation in Csf1r−/− hosts.
(A) Schematic for in vivo Csf1r−/− transplant experiments (B) Rendered tile stitches of Csf1r−/− brains after intracranial injection of GFP+ bone marrow (left) or ER-Hoxb8 (right) progenitor cells (C) Percent of total brain area tiled by donor cells; n = five to seven biological replicates per group; each dot = one biological replicate (average area across three matched sagittal sections) (D) Immunostaining of cortical brain region 12–16 days post-intracranial injection (red = IBA1, green = endogenous GFP, blue = DAPI; scale bar = 100um; inset scale bar = 5um) (E) Cortical density calculations (cells per mm2) between groups; n = five to seven biological replicates per group; each dot = one biological replicate (average density across three regions of interest across three matched sagittal sections). All p-values calculated via one-way ANOVA with multiple comparisons; ns = not significant or p >= 0.05, *p < 0.05, **p < 0.01, ***p < 0.001, ****p < 0.0001

