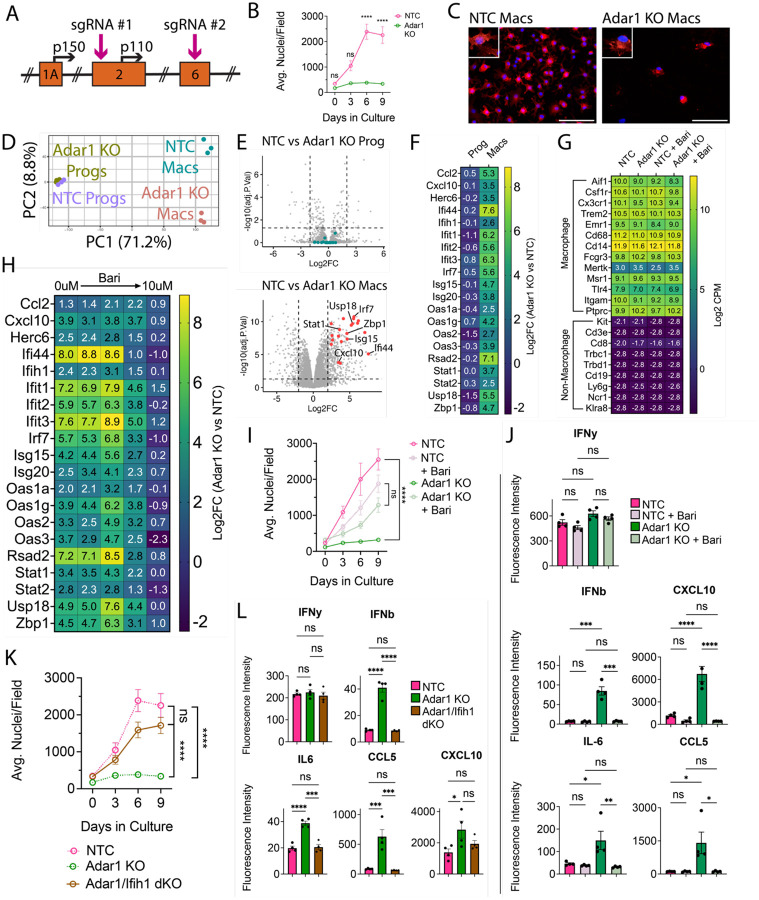
Figure 4: Adar1 mutation prevents macrophage-lineage cell expansion and causes interferon induction, rescued by JAKi or Ifih1 mutation.
(A) Schematic of ADAR1 locus, depicting exons, alternative start sites for p150 and p110 isoforms, and sgRNA targets (B) ER-Hoxb8 cell counts over differentiation time course (C) Immunostaining of in vitro, eight-day differentiated macrophages comparing control (NTC) and Adar1 guide-transduced macrophages (red = CD11B, blue = DAPI; scale bar = 100um) (D) PCA plot of progenitors and macrophages in vitro (E) Volcano plots showing differentially expressed genes between Adar1 KO and NTC progenitors and macrophages (CPM > 1, Log2FC >= 2, FDR < 0.05) (F) Heatmap showing the Log2FC (Adar1 KO values over NTC values) for relevant interferon-stimulated genes (G) Heatmap showing Log2 CPM of canonical macrophage (top) and non-macrophage (bottom) immune cell genes (H) Heatmap showing Log2FC (Adar1 KO over NTC expression) for interferon-stimulated genes in macrophages treated with baricitinib (I) ER-Hoxb8 cell counts over differentiation time course, comparing the effect of baricitinib on Adar KO and NTC lines (dosages = 0uM, 0.00064uM, 0.16uM, 0.4uM, and 10uM) (J) Interferon, cytokine and chemokine production after treatment with baricitinib via cytokine bead array (K) ER-Hoxb8 cell counts over differentiation time course, comparing NTC, Adar1 KO, and Adar/Ifih1 double KO (dKO) lines - dotted NTC and Adar1 KO lines are equivalent to those shown in panel (B) (L) Interferon, cytokine and chemokine production via cytokine bead array, comparing NTC, Adar KO, and Adar/Ifih1 dKO lines. All p-values calculated via one-way ANOVA with multiple comparisons; ns = not significant or p >= 0.05, *p < 0.05, **p < 0.01, ***p < 0.001, ****p < 0.0001

