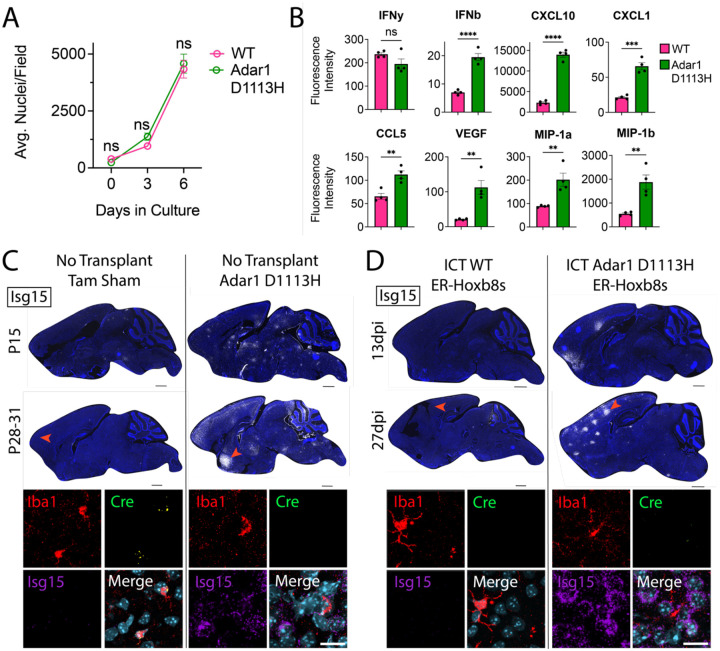
Figure 6: Adar1 D1113H mutant ER-Hoxb8 macrophages persistently drive brain ISG expression.
(A) In vitro ER-Hoxb8 cell counts over time (p-values calculated via one-way ANOVA with multiple comparisons) (B) Multiplex bead array data for interferons, cytokines, and chemokines produced via ER-Hoxb8 macrophages (p-values calculated via one-way ANOVA with multiple comparisons) (C) Sagittal sections of non-transplanted (tamoxifen (tam) sham control) Cx3cr1CreERT; Csf1rfl/fl brains (left) and Adar1 D1113H mutant brains (right) at age P15 and P28–31; nuclei (blue, DAPI), Isg15 (white via RNA in situ hybridization (ISH)); scale bar = 1000um; red arrow depicts location of corresponding closeup images below, showing IBA1 (red, protein stain), Cre (green, ISH), Isg15 (purple, ISH), and nuclei (teal, DAPI); scale bar = 20um; see Supplemental Figure 7A for further corresponding closeup images (D) Sagittal sections of Cx3cr1CreERT; Csf1rfl/fl brains intracranially transplanted with WT ER-Hoxb8s (left) and Adar1 D1113H ER-Hoxb8s (right) at 13 and 27 days post-injection (dpi); nuclei (blue, DAPI), Isg15 (white, ISH); scale bar = 1000um; red arrow depicts location of corresponding closeup images below, showing IBA1 (red, protein stain), Cre (green, ISH), Isg15 (purple, ISH), and nuclei (teal, DAPI); scale bar = 20um; see Supplemental Figure 7A for further corresponding closeup images

