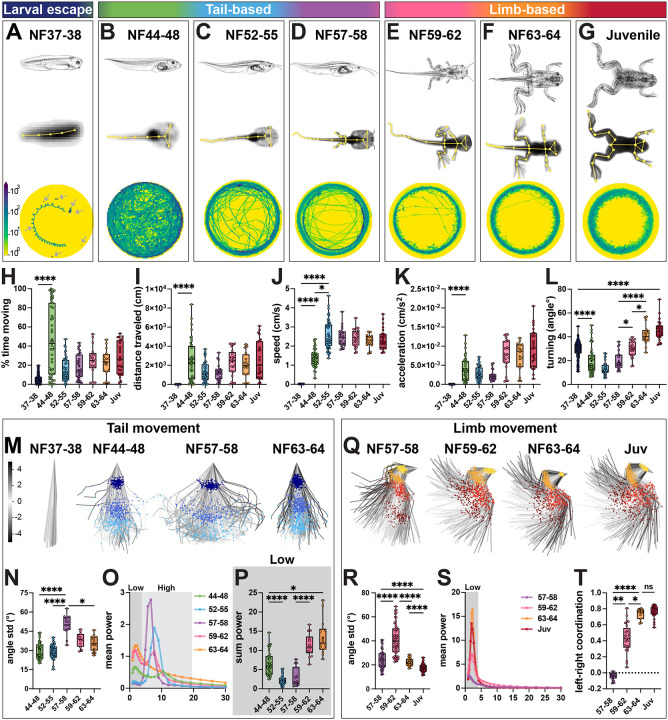
Figure 1. Loss of tail and emergence of limb movement during frog metamorphosis.
A-G. Larval escape, tail-based and limb-based locomotion during Xenopus laevis metamorphosis. Stages across frog metamorphosis are divided into seven bins according to their anatomical features (Nieuwkopp and Faber; NF116): NF37–38 (A; dark blue), NF44–48 (B; green), NF52–55 (C; blue), NF57–58 (D; purple), NF59–62 (E; pink) NF63–64 (F; orange) and juvenile (G; red). We further grouped stages in larval escape (A), tail-based (B-D) and limb-based (E-G). For each stage, a schematic of tadpole anatomy (top row, adapted from Xenopus illustrations © Natalya Zahn, 2022117); a SLEAP skeleton (yellow) superimposed onto an image of a recorded animal with all tracked points indicated (A-G, middle row); and an example of the distance traveled by 7 animals for NF37–38 (A, bottom row, arrows) or by a single animal from NF44–48 to juvenile stage (B-G, bottom row) are shown. Trajectories of the distance traveled show distinct patterns at each stage: coiling escape swimming (A; animals are mostly stationary), free-feeding exploration of the whole dish (B) with a transition to edge tracking from NF44–48 (B) to juvenile (G) stage.
H-L. Quantification of tadpole and frog movement. The percentage of time spent moving (H) and the length of the distance traveled (I) per one-hour imaging session, increase from NF37–38 to NF44–48 and then stay constant for successive stages (H-I; NF37–38 versus NF44–48, p = <0.0001). Mean speed increases stepwise from NF37–38 to NF52–55, and then remains constant (J; for NF37–38 versus NF44–48 and NF37–38 versus NF52–55, p = <0.0001; NF44–48 versus NF52–55, p = 0.019). Acceleration increases from NF37–38 to NF44–48 and then remains constant (K, NF37–38 versus NF44–48, p = <0.0001). Turning, calculated as the mean directional change of the body-part trajectory every 8th frame, decreases from NF37–38 to NF44–48, then increases from NF57–58 to juvenile stage (L; 0 degree angle is parallel indicating no turning; for NF37–38 versus NF44–48, NF37–38 versus juvenile and NF57–58 versus NF63–64, p = <0.0001; for NF57–58 versus NF59–62 and NF59–62 versus NF63–64, p = 0.02).
M-P. Range and frequency of tail movement change across tadpole metamorphosis. PCA plots represent the position of the tail and its range of movement during 256 random frames (M; tail top, dark blue; tail mid, blue; tail tip, light blue). The first visible increase in tail movement is from NF37–38 to NF44–48 and the second from NF44–48 to NF57–58, then the range decreases from NF57–58 to NF63–64 (M). Quantification of the range of movement at the tail tip shows a peak at NF57–58 and a decrease from NF59–64 as the tail recedes (N; for NF44–48 versus NF57–58 and NF52–55 versus NF57–58, p = <0.0001; NF57–58 versus NF63–64, p = 0.048). Mean power spectrum of frequency of tail tip oscillations for each stage of metamorphosis, with low (0.9–4.5 Hz, dark gray) and high (4.5–20 Hz, light gray) frequency bins highlighted (O). From NF44–48 to NF59–62, the frequency spectrum is bimodal with a peak in the low and high frequency bins; at NF63–64, it is unimodal with only one low frequency peak (O). The amount of tail tip movement in the low frequency bin, represented by the sum power, decreases from NF44–48 to NF52–55, and then increases until NF63–64 (P; for NF44–48 versus NF52–55 and NF57–58 versus NF59–62, p = <0.0001; NF44–48 versus NF63–64, p = 0.02).
Q-T. Gain of hindlimb movement during frog metamorphosis. PCA plots represent the position of the hindlimb and its range of movement during 256 random frames showing an increase in range from NF57–58 to NF59–62 (Q; hip, yellow; knee, orange; ankle, red; foot, brown). Quantification of the range of knee movement shows an initial increase from NF57–58 to NF59–62 and then a decrease until juvenile stage (R; for NF57–58 versus NF59–62, NF57–58 versus juvenile, NF59–62 versus NF63–64, and NF63–64 versus juvenile, p = <0.0001). Mean power spectrum of the knee oscillations for each stage of metamorphosis shows a single peak in the low frequency range (S; 0.9–4.5 Hz, dark gray). Coordination of the left and right knees changes from random at NF57–58 to bilaterally synchronous at NF63–64 (T; +1 = synchronous, 0 = random, −1 = alternating; NF57–58 versus NF59–62, p = 0.003; NF57–58 versus NF63–64, p = <0.0001; NF59–62 versus NF63–64, p = 0.02).
n = 172 animals for NF37–38; n = 47 animals for NF44–48; n = 24 animals for NF52–55, n = 11 animals for NF57–58, n = 13 animals for NF59–62, n = 8 animals for NF63–64, n = 13 animals for juvenile stage. Scale bar in A indicates the number of times the animal was present in a specific area of the dish from no time (100 frames, yellow) to many times (103 frames, blue). Scale bar in M indicates the color-code of the first principal component of variation of the aligned tail and limb positions in M and Q.

