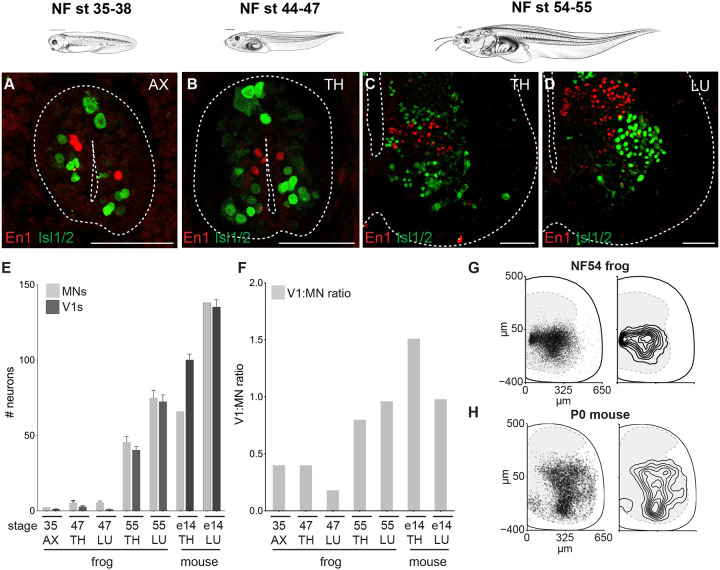
Figure 4. V1 inhibitory interneurons increase in number with metamorphic expansion of motor neurons.
A-D. Immunoreactivity against the Engrailed1 (red), a V1 inhibitory interneuron (V1) marker, and Isl1/2 (green), a motor neuron (MN) marker, labels ~1 V1 and ~2.5 MNs at NF35–38 (A), ~2 V1s and ~5.5 MNs at the thoracic levels at NF44–47 (B), and around ~40 and ~45 V1s and MNs at the thoracic levels (C)and ~72 and ~75 V1 and MNs at the lumbar levels at NF54–55 (D), respectively. Tadpole drawings adapted from Xenopus illustrations © Natalya Zahn (2022).117
E-F. Number (E) and the ratio (F) of V1s and MNs at axial (NF35), thoracic and lumbar (NF47 and 55 tadpole and E14 mouse) levels. At NF35 and NF47, the V1:MN ratio is under 0.5, and then approaches 1 at NF54–55 for both thoracic and lumbar segments in metamorphosing frogs, similar to in the embryonic mouse. Shown in E is the mean ± SEM for n = 4–17 animals per 15 μm ventral horn.
G-H. Position of V1 interneurons at lumbar levels of NF54 frog (G) and P0 mouse (H). Plotted on the left are individual cells with 50% transparent black to highlight overlap.

