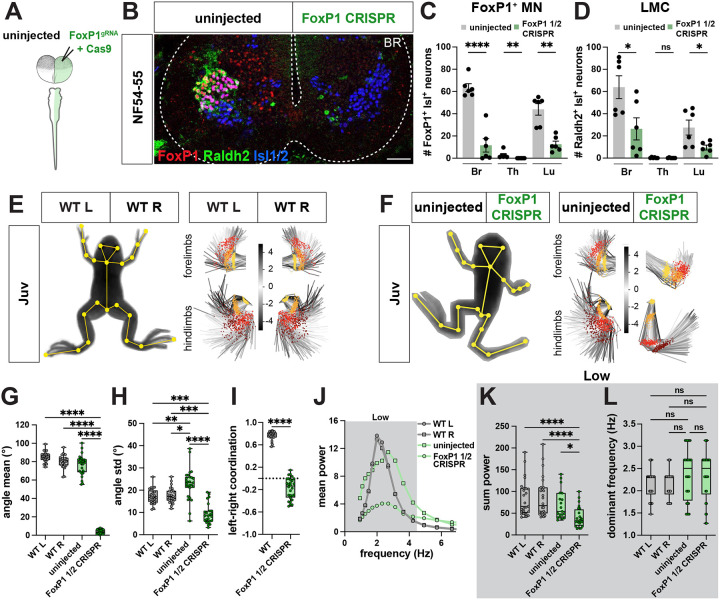
Figure 7. FoxP1 CRISPR loss-of-function causes loss of range and coordination of limb movement in Xenopus frogs.
A-B. Generation of unilateral FoxP1 CRISPR mutant frogs by injection of FoxP1 sgRNA and Cas9 protein in a single cell at two-cell stage (A) results in NF54–55 tadpoles in which FoxP1 (red) and Raldh2 (green) immunoreactivity is selectively absent from the mutant side of the spinal cord (B). Isl1/2-positive (blue, marker for motor neurons in ventral spinal cord) neurons are present on both wildtype and mutant side of spinal cord (B). Scale bar, 50 μm.
C-D. Cell-type characterization in unilateral FoxP1 CRISPR mutant animals. Quantification of spinal cord cell numbers at brachial (Br), thoracic (Th) and lumbar (Lu) reveals loss of FoxP1+ Isl1+ neurons at all levels (C; uninjected vs. FoxP1 ½: Br, p = <0.0001; for Th and Lu, p = 0.002) and loss of Raldh2+ Isl1+ neurons at brachial and lumbar levels (D; uninjected vs. FoxP1 ½: Br, p = 0.025; Lu, p = 0.029). n = 6 for WT, n = 6 unilateral FoxP1 CRISPR.
E-I. Loss of range and coordination of movement of the FoxP1 mutant hindlimb. WT (E) and unilateral FoxP1 CRISPR (F) juvenile frogs with SLEAP skeleton (left, yellow) superimposed on animal image. PCA plots represent the position of the fore and hind limb and their range of movement during 256 random frames and show a different position and range of the FoxP1 CRISPR limbs compared to WT or the uninjected side (E-F, right; hip and shoulder, yellow; knee and elbow, orange; ankle and wrist, red; foot, brown). Scale bar in E and F indicates the color-code of the first principal component of variation of the aligned fore and hind limb positions. The FoxP1 CRISPR mutant knee also differs in its mean angle (G; for WT L versus FoxP1 ½, WT R versus FoxP1 ½ and uninjected versus FoxP1 ½, p = <0.0001), and its movement range is reduced (I; WT L versus FoxP1 ½, p = 0.0006; WT R versus FoxP1 half, p = 0.0002; uninjected versus FoxP1 1/2, p = <0.0001). In contrast, the uninjected side displays a higher range of movement (H; WT L versus uninjected, p = 0.009; WT R versus uninjected, p = 0.025). Left-right coordination between knee joints is lost in FoxP1 CRISPR animals (I; +1 = bilateral synchronous, 0 = random, −1 = alternate synchronous; WT versus FoxP1 ½ CRISPR, p = <0.0001). n = 13 for WT, n = 14 for unilateral FoxP1 CRISPR.
J-L. FoxP1 CRISPR mutant hindlimbs maintain dominant frequency but lose power. Mean power spectrum of knee oscillations shows only one peak in the low frequency range for WT, uninjected and FoxP1 CRISPR hindlimbs (J; 0.9–4.5 Hz, dark gray). At the knee joint, the amount of movement in the low frequency bin (0.9–4.5 Hz), represented by the sum power, is lower on the mutant side compared to both the uninjected side and WT (K; for WT L versus FoxP1 ½ CRISPR and WT R versus FoxP1 ½ CRISPR, p = <0.0001; uninjected versus FoxP1 ½ CRISPR, p = 0.021). Dominant frequency is unaffected on both uninjected and FoxP1 CRISPR sides (L). n = 13 for WT, n = 14 for unilateral FoxP1 CRISPR.

