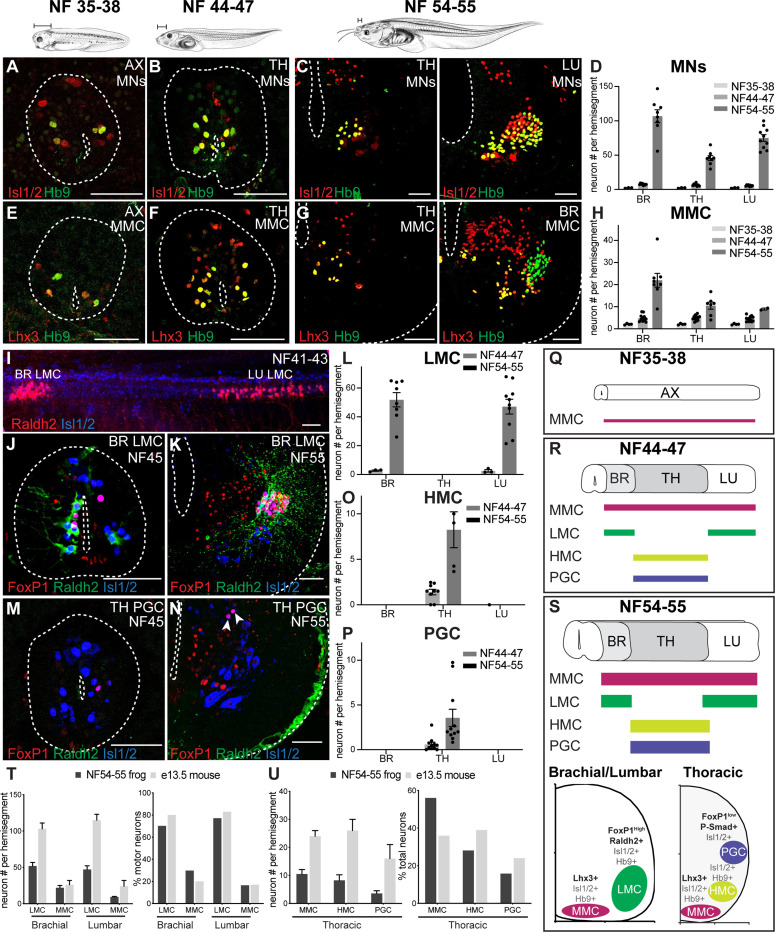
Figure 2. Spinal motor neurons expand and diversify during Xenopus frog metamorphosis.
A-D. Motor neuron number increases during metamorphosis. Motor neurons in the axial (AX), thoracic (TH), and lumbar (LU) spinal cord express the pan-motor neuron markers Hb9 (green) and Isl1/2 (red) and increase in number between NF35–38 (A), NF44–47 (B) and NF54–55 (C). Bar graph (D) shows the total number of Hb9+ Isl1/2+ (NF37–38 and NF44–47) or ventral Isl1/2+ (NF54–55) motor neurons per 15 μm ventral horn (mean ± SEM for n = 3–10 animals) of brachial, thoracic, and lumbar spinal cord.
E-H. Medial motor column (MMC) emerges in larval Xenopus and expands during metamorphosis. The antibody against the Lhx3 transcriptional determinant of MMC identity (red) labels a subset of Hb9+ motor neurons (green) in the spinal cord of NF35–38 (E), NF44–47 (F), and NF54–55 (G) tadpoles. Shown are axial (AX; NF35–38), thoracic (TH; NF44–47 and NF54–55) and brachial (BR; NF54–55) sections (see Figure S3 for the images of additional immuno-labeled TH, BR and LU sections). The graph (H) shows the number of Lhx3+ Hb9+ MMC motor neurons per 15 μm ventral horn (mean ± SEM for n = 4–14 animals) at brachial, thoracic and lumbar levels at NF35–38, NF44–47, NF54–55.
I-P. Lateral (LMC), preganglionic (PGC) and hypaxial (HMC) motor columns emerge in free-swimming tadpoles and expand during metamorphosis. Side view of an NF41–43 spinal cord (I) stained for the LMC determinant, Raldh2 (red), and Isl1/2 (blue) reveals the nascent brachial and lumbar populations of limb-innervating motor neurons. The LMC determinants, FoxP1 (red) and Raldh2 (green), jointly label a motor neuron subset (Isl1/2, blue) at brachial and lumbar levels at NF44–47 (J) and NF54–55 (K). The number of LMC motor neurons (L) per 15 μm ventral horn (mean ± SEM for n = 3–10 animals) of brachial, thoracic, and lumbar segments at NF44–47 and NF54–55. Frog PGC motor neurons labeled by the PGC transcriptional determinants, FoxP1 (red) and Isl1/2 (blue), at thoracic levels at NF44–47 (M) and 54–55 (N). Neither LMC nor PGC is present at NF35–38 (see Figure S3G-J). The number of HMC (O) and PGC (P) motor neurons per 15 μm ventral horn (mean ± SEM for n = 5–11 animals) of brachial, thoracic, and lumbar levels at NF44–47 and NF54–55. HMC motor neuron number at the thoracic level was calculated by subtracting the number of MMC and PGC motor neurons from the total number of motor neurons.
T-U. Conservation of MN proportions in developing limb circuits of frogs and mice. Number of LMC and MMC motor neurons (left) and their percentage (right) in the total motor neuron population at brachial and lumbar levels (T) at frog NF54–55 and E13.5 mouse. Number of HMC, PGC, and MMC motor neurons (left) and their percentage (right) in the total motor neuron population at the thoracic level (U) at frog stage NF54–55 and E13.5 mouse. Shown is the mean ± SEM for n = 5–11 animals. The embryonic mouse counts were extracted from Agalliu et al, 2009 with the SEM estimated from the provided plots.
Q-S. Summary of motor neuron development in tadpoles. Schematics showing the rostrocaudal distribution of MMC (Lhx3+, Isl1/2+ and Hb9+), HMC (Isl1/2+ and Hb9+) and PGC (FoxP1low, Raldh2+, Lhx3+, Isl1/2+ and Hb9+) subsets in NF35–38 (Q), 44–47 (R), and 54–55 (S, top) spinal cords. Schematized spinal cord hemi-section of a limb and thoracic segment depicting the relative position and molecular markers of each motor column along the dorsoventral, mediolateral axis (S, bottom).
Shown is either a spinal cord cross section (NF35–38/44–47) or hemi-section (NF54–55) with the central canal and outer edge indicated (dotted line). Scale bar, 50 μm (except in I, 100μm). Tadpole drawings adapted from Xenopus illustrations © Natalya Zahn (2022).117

