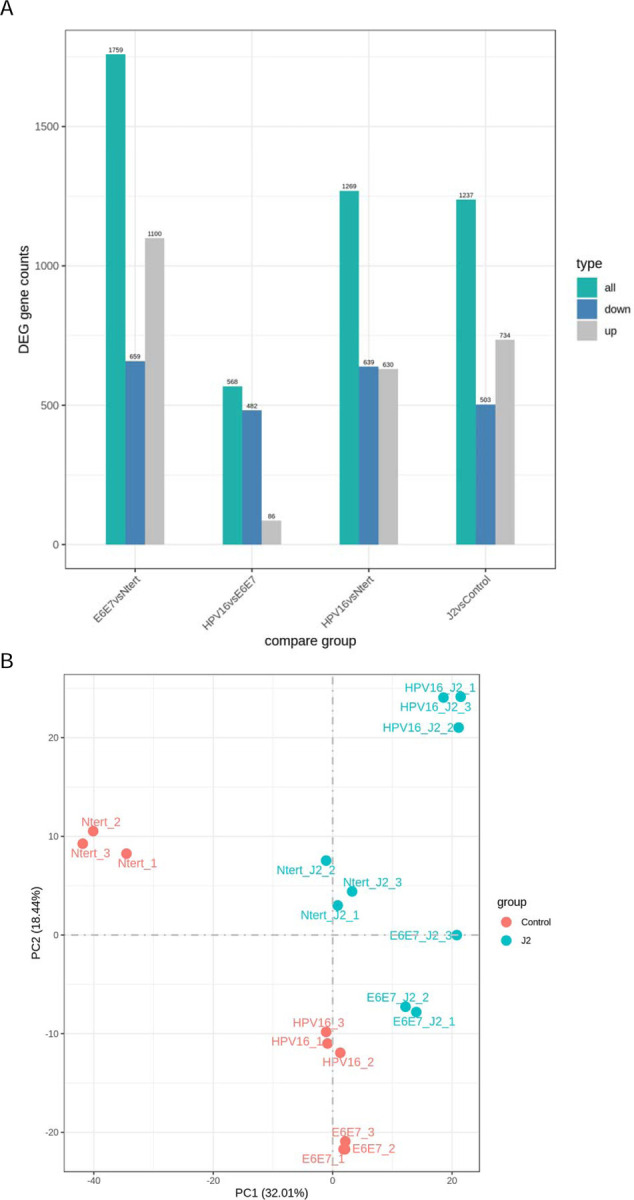
Figure 1. Global comparison of RNA-seq.

1A. RNA-seq differential expression (DEG) analysis histogram comparison of the number of significant differential genes (including up-regulation and down-regulation) for each combination. 1B. Principal component analysis (PCA) analysis on the gene expression value (FPKM) of all samples.
