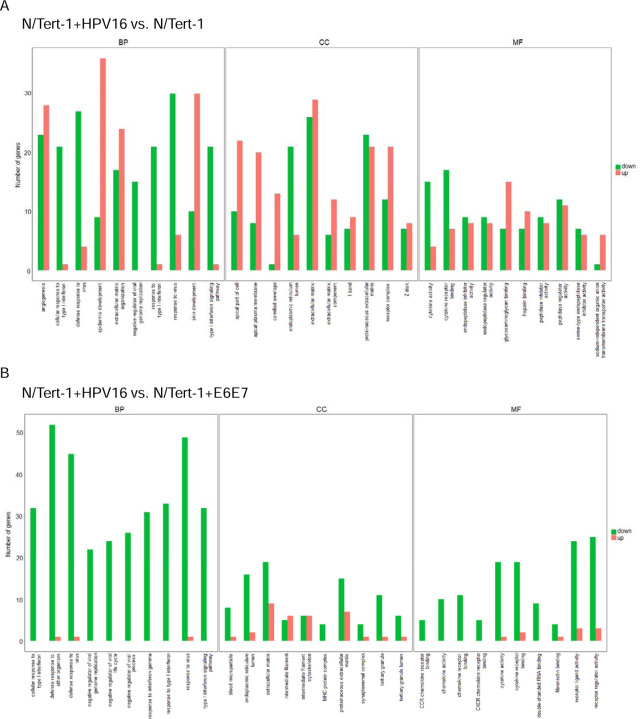
Figure 2. Gene ontology (GO) enrichment analysis histograms demonstrate differential regulation between N/Tert-1 cell lines and between mono vs co-culture.
The 30 most significantly GO terms are displayed. All Terms are separated according to major categories of biological processes (BP), cell components (CC), molecular functions (MF) and categories of upregulated and downregulated expression of noted GO. 2A. Grouped N/Tert-1+HPV16 are compared to Grouped N/Tert-1. 2B. Grouped N/Tert-1+HPV16 are compared to Grouped N/Tert-1+E6E7. 2C. Grouped N/Tert-1+E6E7 are compared to Grouped N/Tert-1. 2D. Grouped fibroblast co-culture cell line sets (J2) are compared to Grouped mono-culture cell line sets (Control).


