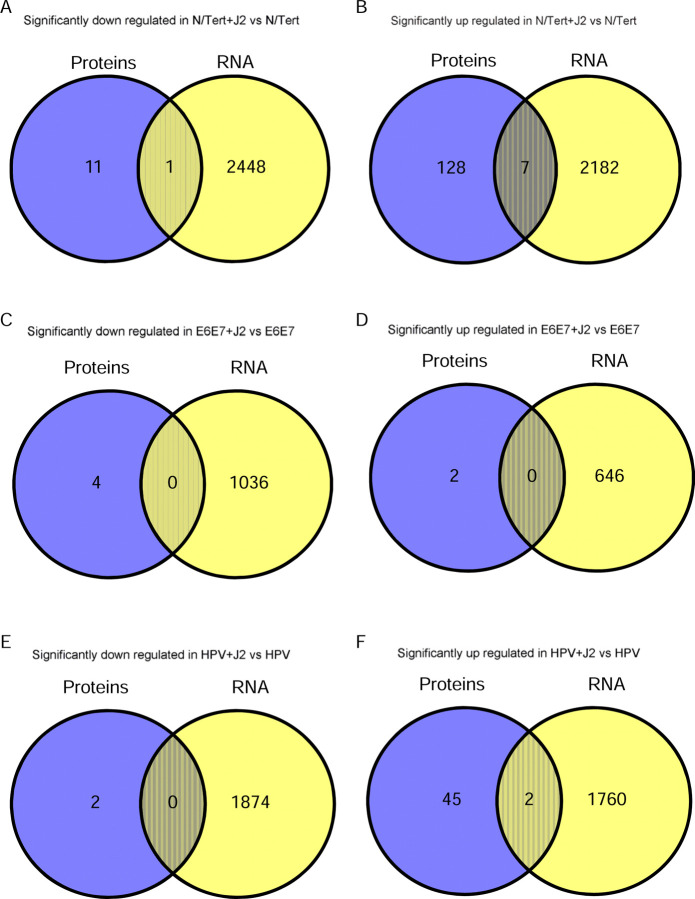
Figure 8. Differential expression Venn diagrams comparing significant up or down regulation via fibroblasts in RNA-seq and proteomic analysis.
The sum of all the numbers in the circle represents the total number in the compared groups, and the overlapping area indicates the number of differential genes shared between the groups, as shown in the following figures. 8A,B. Cross comparison of N/Tert-1 downregulation, and upregulation, respectively via fibroblasts. 8C,D. Cross comparison of N/Tert-1+E6E7 downregulation, and upregulation, respectively via fibroblasts. 8E,F. Cross comparison of N/Tert-1+HPV16 downregulation, and upregulation, respectively via fibroblasts.

