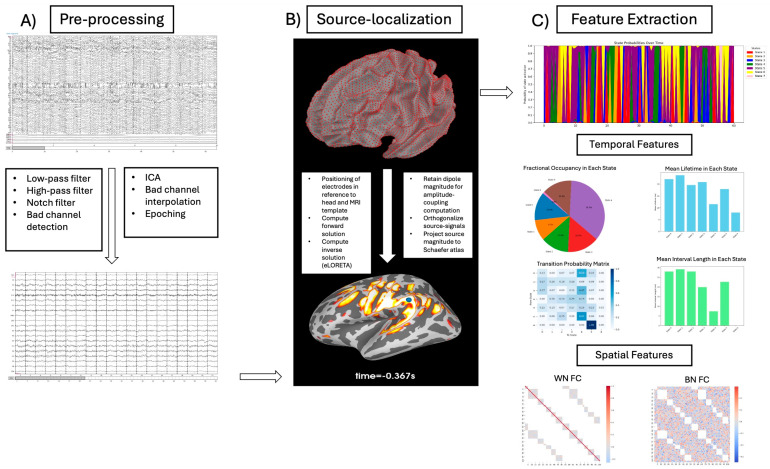
Figure 1.
A summary of the processing pipeline used. Panel (A) depicts the process through which raw data were pre-processed and prepared for source localization; Panel (B) displays the MRI template used for source localization, and it summarizes the processes through which the EEG signal underwent source reconstruction/localization; Panel (C) shows a hidden Markov model from which temporal and spatial features were extracted. WN = within network; BN = between network; FC = functional connectivity.

