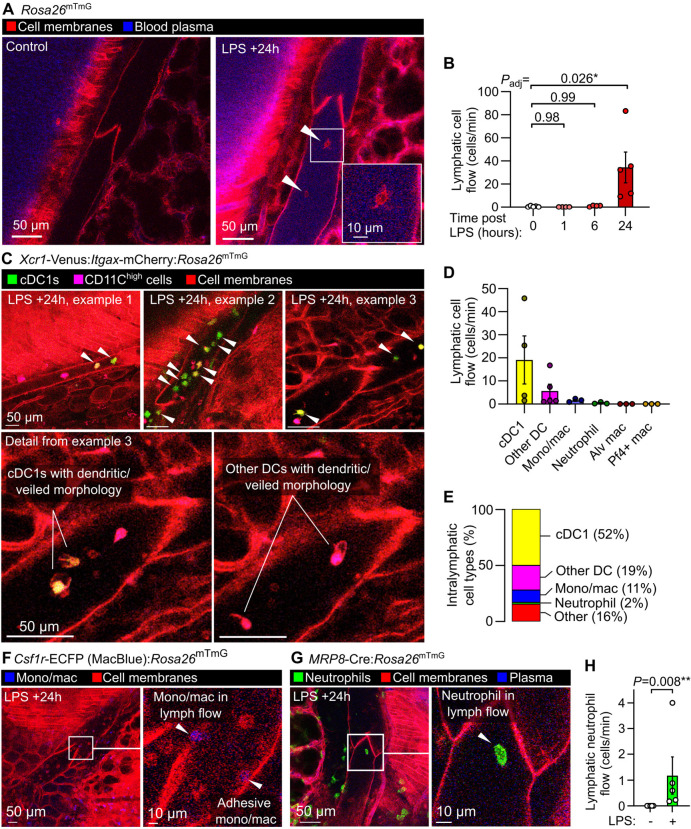
Figure 3: Dynamics and diversity of leukocyte trafficking within intact pulmonary lymphatics.
(A) Pulmonary lymphatic vessels from a steady-state control and LPS-treated Rosa26mTmG mice at 24 hours after onset of LPS-induced lung inflammation with arrowheads pointing to intralymphatic leukocytes. (B) Quantification of lymphatic flow of leukocytes. (C) Pulmonary lymphatics in Xcr1-Venus:Itgax-mCherry:Rosa26mTmG mice at 24 hours after LPS treatment with arrowheads pointing to Xcr1-Venus+ cDC1s, with cell types in lymphatics quantified in (D) and (E) using the mouse lines shown in this figure and in Figure S2. Pulmonary lymphatic vessels from (F) Csf1r-ECFP:Rosa26mTmG monocyte/macrophage reporter mouse or (G) MRP8-Cre:Rosa26mTmG neutrophil reporter mouse 24 hours after LPS treatment with (H) quantification of lymphatic flow of neutrophils. Graphs show means ± SEM. P-values are from: (B) Kruskal-Wallis test with Dunn’s multiple comparisons to 0 hours (naïve) group; or (H) Mann-Whitney test. Group sizes: (B) n=4 (+1 and +6 hour groups), n=5 (0 and +24 hour groups); (H) n=5.

