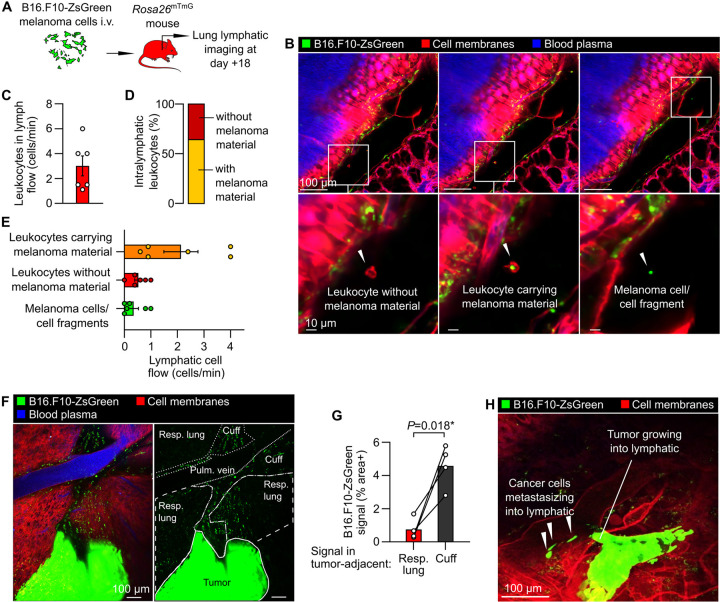
Figure 5: Tumor-immune interactions and metastasis within pulmonary lymphatics.
(A) Schematic diagram summarizing B16.F10-ZsGreen melanoma mouse model. (B) Images of leukocytes carrying melanoma material, leukocytes without melanoma material and melanoma cell/cell fragments in lymph flow, with (C) quantification of total leukocyte flow and (D, E) breakdown of cell types observed in lymphatics. (F) Overview showing metastatic tumor in lung with (G) enrichment of bronchovascular cuff space (‘cuff’) relative to respiratory (‘resp.’, i.e. alveolar) lung. (H) Image showing intralymphatic tumor with melanoma cells detaching to enter lymph flow. Graphs show means ± SEM. P-value in (G) is from a 2-tailed, paired t-test. Group sizes: (B, D) n=6, (F) n=4.

