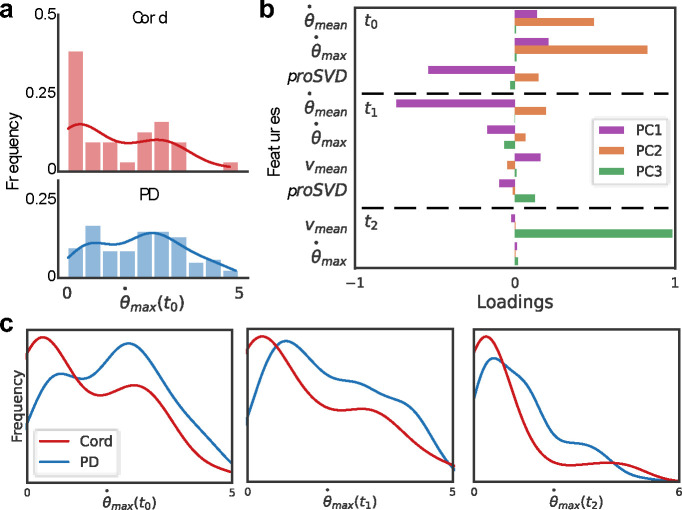
Figure 10: Different motion features evoked by stimulus location.
(A) Histograms and overlaid kernel density estimation plots for the extracted maximum angular velocity in t0 for each video during (top) cord or (bottom) proximal or distal (PD) stimulation. (B) A principal component analysis was performed for all extracted behavior features. Selected features are shown here with higher loadings across the first three principal components (PC). The mean and maximum angular velocities and proSVD features across the first two time periods comprise much of the first two PCs, with the distal velocity in the last time period having the highest loading onto the third PC. (C) The distributions of this metric, maximum angular velocity, are significantly different across all post-stimulation time windows (for t0, t1, t2; p=0.014, p=0.001, p=0.004, respectively, determined by a two-sample KS test).

