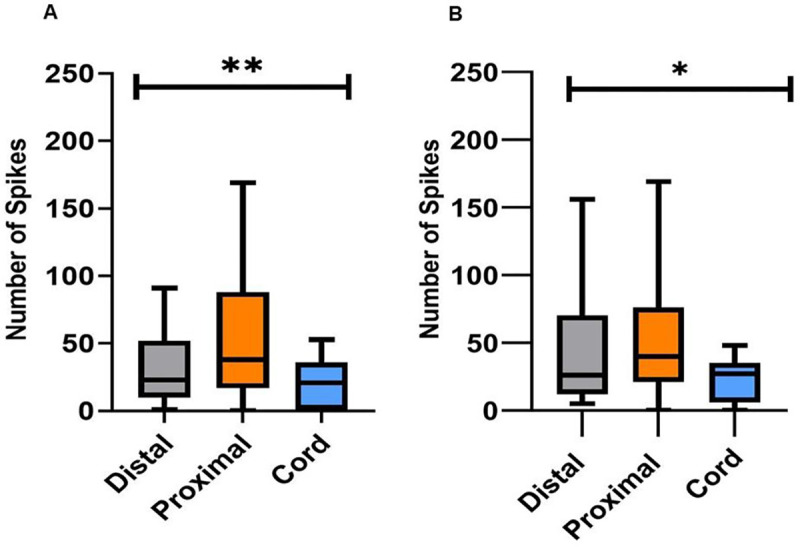
Figure 4. The stimulation type and number of spikes.

(A) The average number of unit responses within 50ms after stimulation and the location of the stimulation. (B) The average number of unit responses within 50–100ms after stimulation and the location of the stimulation. Between the two time periods, the greatest increase in units was found to be associated with distal stimulations. (ANOVA, *<0.05; **<0.005; n=7 octopuses, data obtained form 14 arms).
