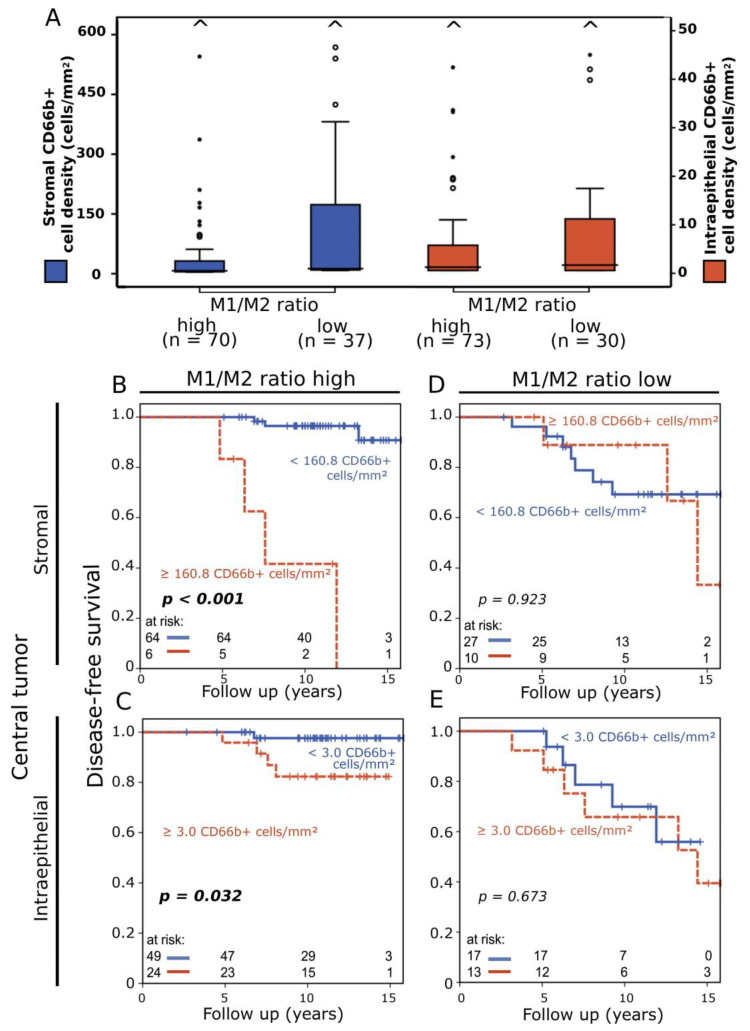
Figure 4.
(A) Box plots of stromal (blue) and intraepithelial (red) CD66b+ cell density distribution in patients with high versus low M1/M2 ratio. Carets signify outliers. (B,C) Disease-free survival rate according to stromal (B) and intraepithelial (C) CD66b+ neutrophil density in central breast tumor samples in patients with a high M1/M2 ratio analyzed with the Kaplan–Meier method and log-rank test. (D,E) Disease-free survival according to stromal (D) and intraepithelial (E) CD66b+ neutrophil density in central tumor samples in patients with a low M1/M2 ratio.

