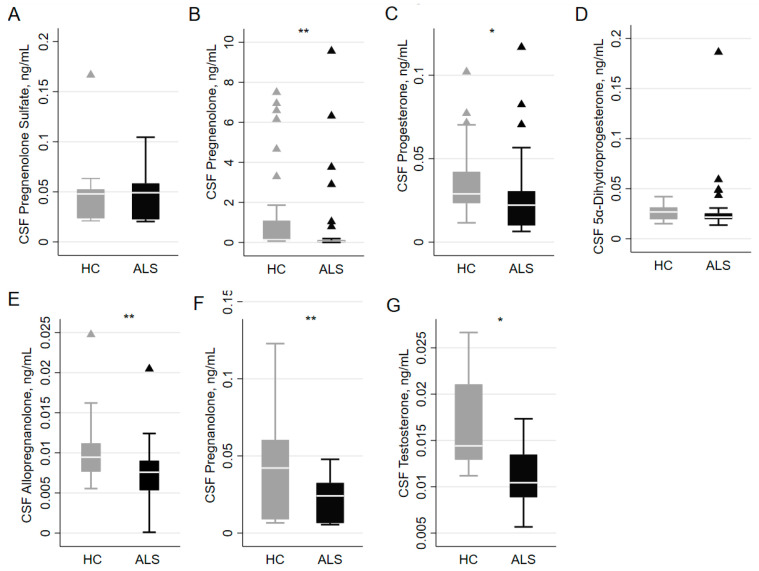
Figure 1.
CSF concentrations (ng/mL) of different NSs in ALS and HC groups. In detail from left to right, (panel A) shows CSF concentration of pregnenolone sulfate, (panel B) of pregnenolone, (panel C) of progesterone, (panel D) of 5α-dihydroprogesterone, (panel E) of allopregnanolone, (panel F) of pregnanolone, and (panel G) of testosterone, respectively, in ALS patients (black) and HCs (gray). Mann–Whitney U test, * means p < 0.05, ** means p < 0.01.

