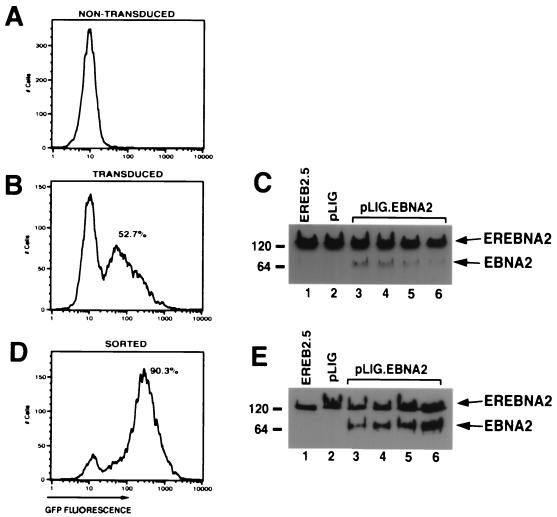
FIG. 3.
Transduction and expression of EBNA2 into EREB2.5 cells. (A) FACS analysis of EREB2.5 cells for GFP fluorescence. (B) FACS analysis of GFP expression in EREB2.5 cells transduced with pLIG.EBNA2 virus. (C) Western blot analysis of cellular extracts from EREB2.5 cells (lane 1), pLIG-transduced EREB2.5 cells (lane 2), and four independently derived cell pools from EREB2.5 cells transduced with pLIG.EBNA2 virus (lanes 3 to 6). The blots were probed with the PE2 monoclonal antibody against EBNA2. Migration of both endogenous EREBNA2 and wild-type EBNA2 expressed from the pLIG vector are indicated on the right of the blot. (D) FACS analysis of pLIG.EBNA2-transduced EREB2.5 cell lines that have been sorted for the top 15% of GFP-positive cells as shown in panel B. (E) Western blot analysis of cellular extracts from EREB2.5 cells (lane 1), pLIG-transduced and sorted (as described in Materials and Methods) EREB2.5 cells, and four similarly derived pools of EREB2.5 cells transduced (as in panel C) with pLIG.EBNA2 virus and then sorted as described in Materials and Methods (lanes 3 to 6). The blots were probed with the PE2 monoclonal antibody against EBNA2. Migration of both endogenous EREBNA2 and wild-type EBNA2 expressed from the pLIG vector are indicated on the right of the blot.

