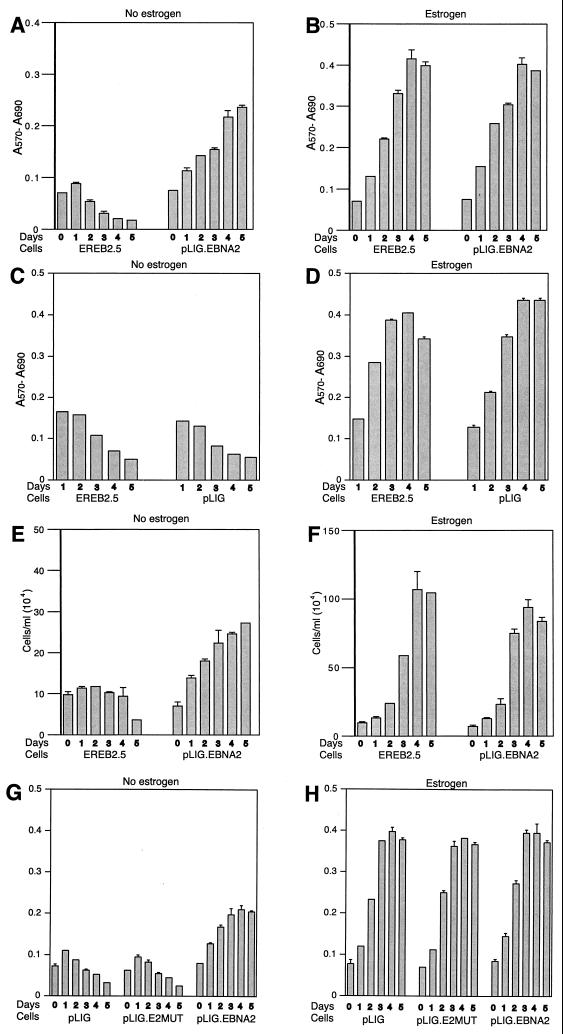
FIG. 4.
Proliferation of transduced EREB2.5 cells expressing wild-type EBNA2 after estrogen starvation. (A) Ten thousand cells/well of the indicated cells were plated into 96-well plates in growth medium without estrogen. Cell proliferation was monitored by MTT assays as described in Materials and Methods each day over the course of 5 days. (B) Same as for panel A, except that cells were grown in media containing estrogen. (C and D) Same as for panels A and B, except that the comparison was between EREB2.5 and pLIG-transduced EREB2.5 cells as indicated below the graphs. (E) The indicated cell lines were plated out as described for panel A, except that cells were removed, stained with trypan blue, and counted each day over a 5-day period. (F) Same as for panel E, except that cells were grown in media containing estrogen. (G and H) Same as for panels A and B, except that growth rate comparisons are between pLIG-, pLIGE2mut.-, and pLIG.EBNA2-transduced cell lines.

