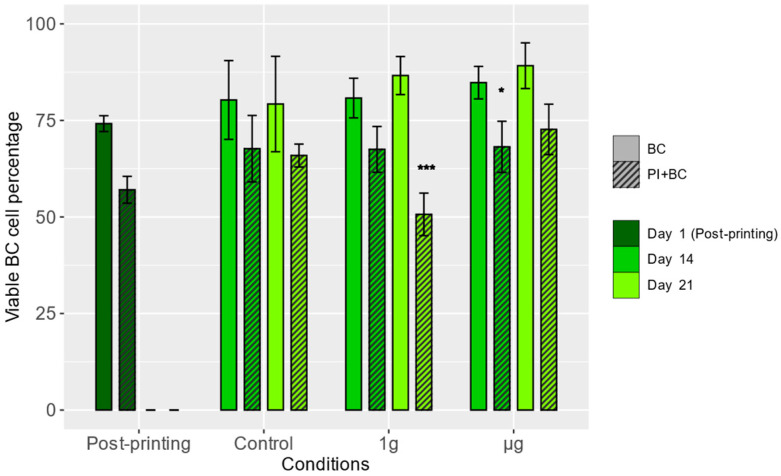
Figure 1.
BC viability in bioprinted scaffolds. The viability percentage was calculated by dividing the number of live BCs by the total number of BCs observed in images of the samples. Means (columns) and standard deviations (error bars) are displayed. Stars denote statistically significant (*—p < 0.05, ***—p < 0.001) differences between the means measured in BC and PI+BC samples on a specific day and treated with specific conditions. N = 3 (post-printing groups), N = 4 (other groups).

