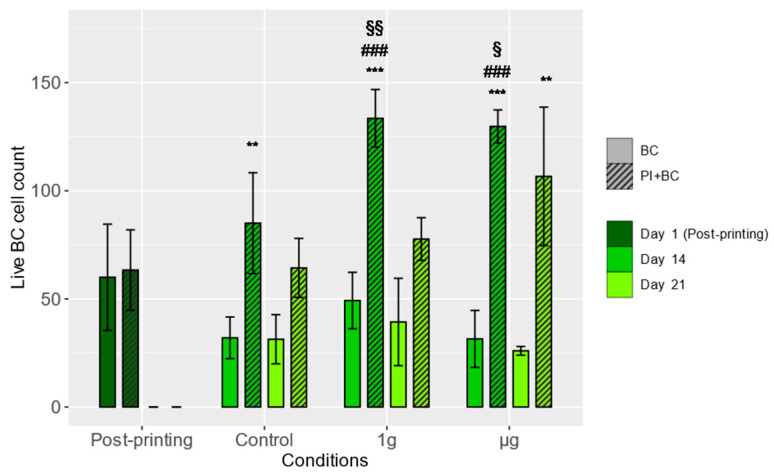
Figure 2.
Live cell counts of BCs in 3D-printed scaffolds. Asterisks denote statistically significant (0.05, **—p < 0.01, ***—p < 0.001) differences between the means measured in BC and PI+BC samples at the indicated days and subjected to different experimental conditions. Means (columns) and standard deviations (error bars) are displayed. Section signs denote statistically significant (§—p < 0.05, §§—p < 0.01) differences between the specified and equivalent ground control groups. Hashes denote statistically significant (###—p < 0.001) differences between the means of the specific measurements and the measurements of Day 1, the post-printing samples. N = 3 (post-printing groups), N = 4 (other groups).

