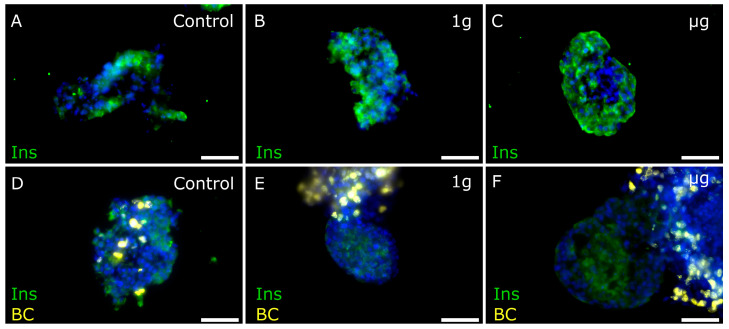
Figure 5.
Representative images of insulin staining of free-floating PI and PI+BC samples. (A–C): PI samples that underwent ground control, 1 g, and µg conditions, respectively, showing insulin staining (green). (D–F): PI+BC samples that underwent ground control, 1 g, and µg conditions, showing BC presence (yellow) and insulin staining (green). Nuclei stained blue with Hoechst. Bar = 100 µm.

