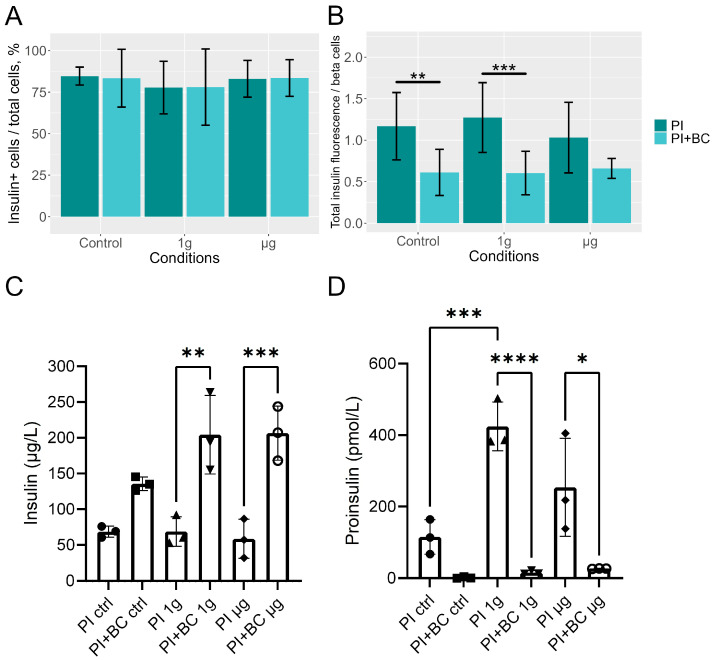
Figure 6.
The percentage of free-floating PI cells positive for insulin (A) and relative insulin fluorescence (B) in the imaged samples. BC signals were removed prior to calculations. Means (columns) and standard deviations (error bars) are displayed in graphs. Stars denote statistically significant (*—p < 0.05, **—p < 0.01) differences between means. The PI sample sizes were 11, 11, and 9 for control, 1 g, and µg groups, respectively (A), and 15, 14, and 13, respectively (B). The PI+BC sample sizes were 13, 10, and 11 for control, 1 g, and µg groups, respectively (A), and 15, 13 and 13, respectively (B). Insulin (C) and proinsulin (D) content of supernatants as measured by ELISA. Data (bars) are means and standard deviations of three samples per condition analyzed in technical duplicates. One-way ANOVA (*—p < 0.05, **—p < 0.01, ***—p < 0.001, ****—p < 0.0001).

