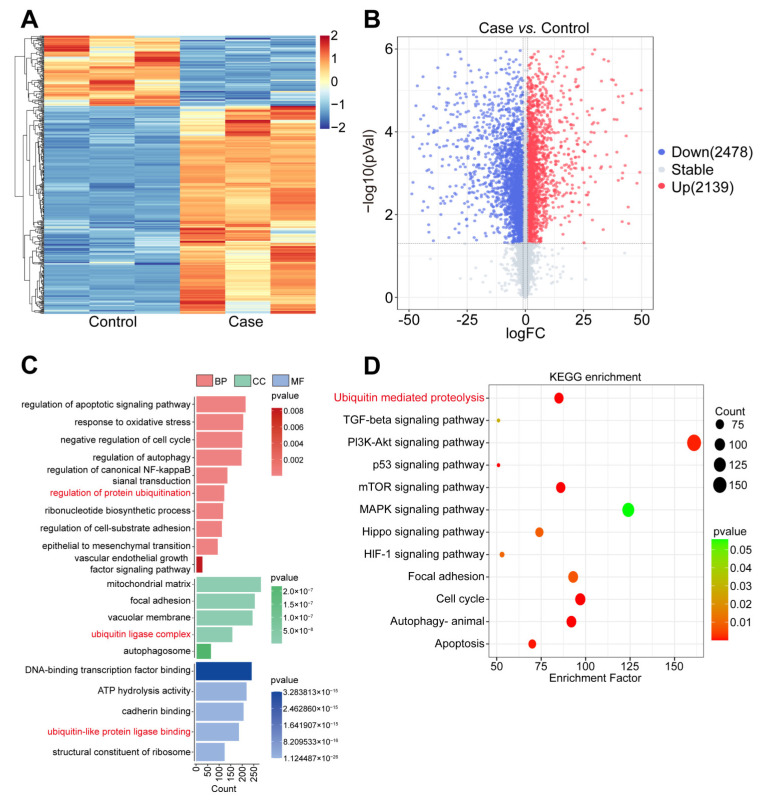
Figure 1.
Curcumol treatment altered the transcriptomics profile of NPC cells. (A) Heatmap of DEGs after curcumol treatment. (B) Volcano plots of DEGs after curcumol treatment. (C) GO annotation of DEGs, which were divided into BP, CC, and MF. (D) KEGG pathways’ enrichment analysis bubble plot of DEGs.

