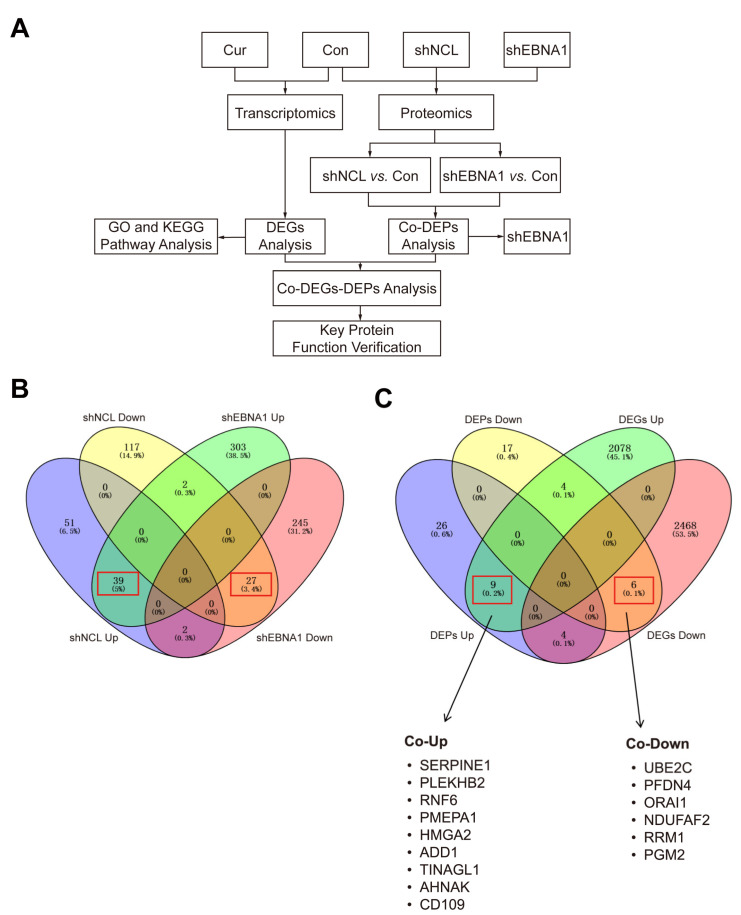
Figure 4.
Correlation analysis of transcriptomics and proteomics revealed key proteins in the inhibition of NPC by curcumol. (A) Flow chart of key target approaches for curcumol inhibition of NPC. (B) Venn diagram of DEPs for “shNCL vs. Control” and “shEBNA1 vs. Control”, red boxes indicate the number of DEPs regulated in the same direction. (C) Venn diagram of DEGs and DEPs, and common key targets shown, red boxes were same with (B).

