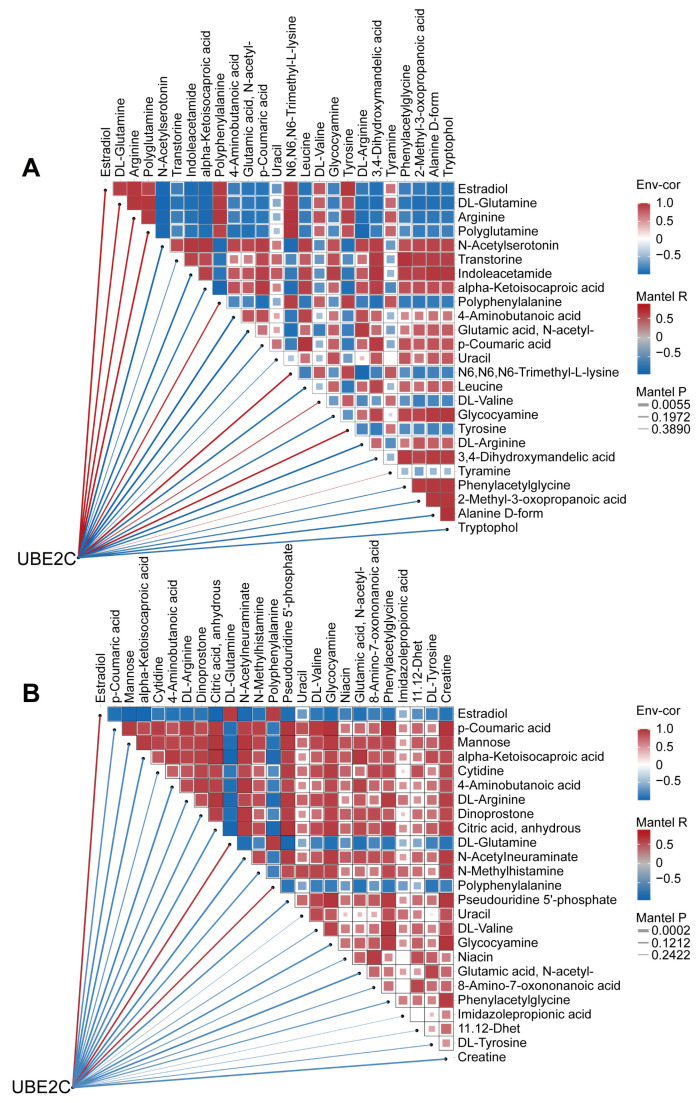
Figure 8.
Combined metabolomics and proteomics analyses revealed that 4-Aminobutanoic acid (GABA) was highly negatively correlated with UBE2C. (A) Heatmap of the correlation network of UBE2C, NCL and differential metabolites in “shNCL vs. Control”. (B) Heatmap of correlation network of UBE2C, NCL with differential metabolites in “shEBNA1 vs. Control”.

