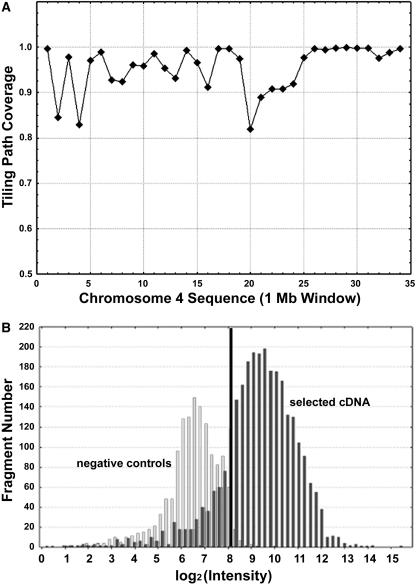
Figure 2.
Tiling Array Coverage and Expression Threshold Determination.
(A) Coverage of the tiling path microarray. The coverage was calculated by dividing the tiling path covered region (overlaps removed) by the entire region in 1-Mb windows across rice chromosome 4.
(B) Expression threshold determination. The histogram in light gray shows the distribution of 257 negative control spots in a representative experiment. We selected a cutoff, shown by a black line, at which only 1% of the negative control spots scored as false positives. The distribution in dark gray represents the intensities of 515 selected fragments with cDNA support.

