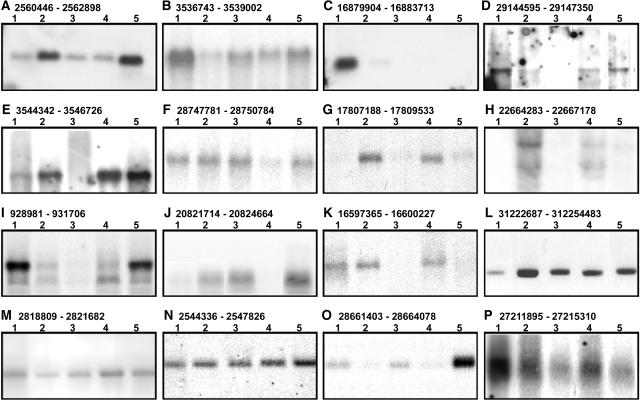
Figure 4.
RNA Gel Blot Analysis of 16 Representative Nonannotated DNA Fragments.
The transcripts were detected in 16 nonannotated regions with the chromosome coordinates of each fragment shown at the top of each panel. In total, 21 nonannotated fragments were analyzed, with 16 (76%) showing hybridization signals. The remaining five nonannotated DNA fragments did not present hybridization signals under our conditions. The RNA samples from cultured cells or specific organs subjected to microarray analysis were used for RNA gel blot analysis with the following order, from lane 1 to lane 5: cultured cells, seedling shoot, seedling root, flag leaf, and panicle.

