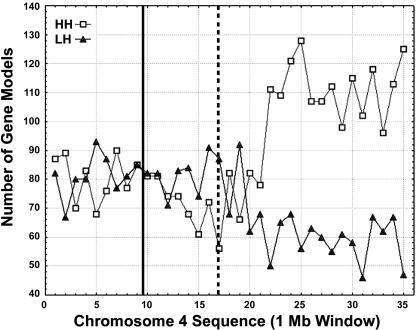
Figure 7.
Density Distribution of HH and LH Gene Models Along Rice Chromosome 4 in a 1-Mb Window.
HH and LH gene models were defined by homology search with all Arabidopsis gene models using tBLASTN (for details, see Methods). Solid line, centromere; dotted line, the last major knob of the chromosome 4 heterochromatin half.

