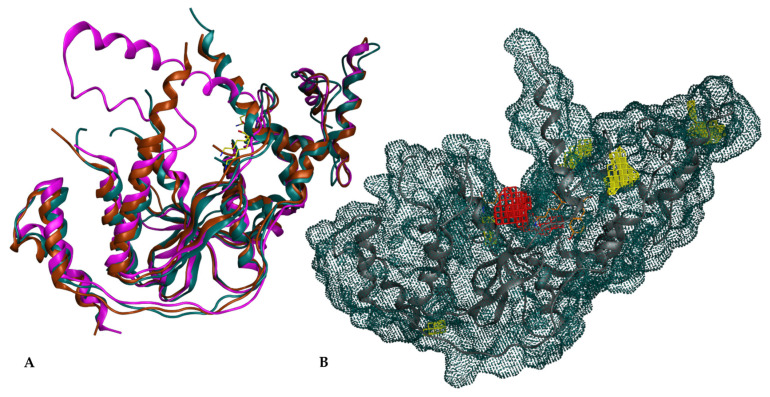
Figure 2.
XPG structure and surface representation. (A) Overlap of XPG structures from PDB IDs: 6TUR (turquoise), 6TUX (maroon), 6VHB (purple) and Lys84 of each structure (yellow); (B) Molecular surface representation of XPG, tinted in turquoise, highlighting the active site in red and alternative cavities in yellow.

