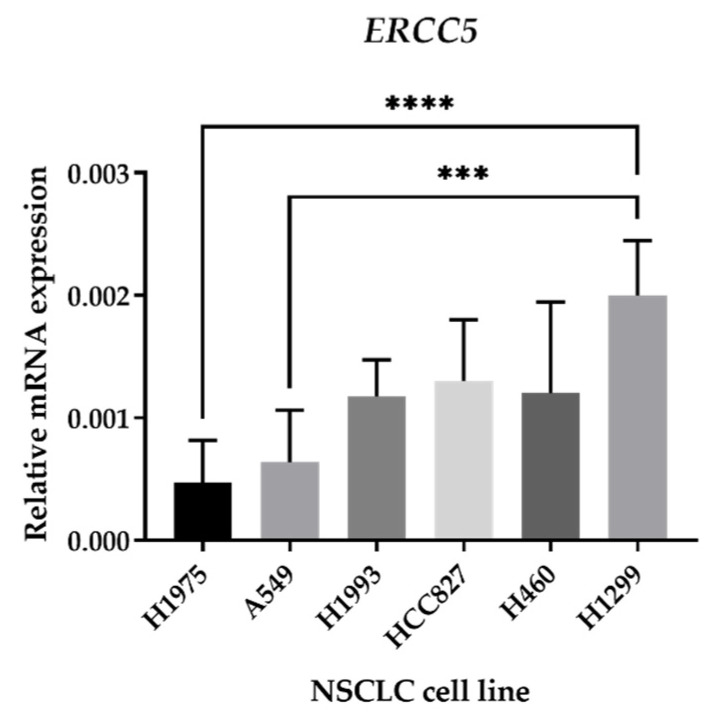
Figure 8.
mRNA expression of the ERCC5 gene in NSCLC cell lines. qRT–qPCR was used to analyze ERCC5 expression of all six NSCLC cell lines using isolated RNA samples. Relative expression was obtained by calculating 2−∆Ct, where ∆Ct = Average Ct (gene of interest)—Average Ct (β-ACTIN) and normalized it to β-ACTIN. The results are presented as mean ± SD (n = 3). *** p < 0.001 and **** p < 0.0001 (one-way ANOVA, Tukey’s multiple comparisons test).

