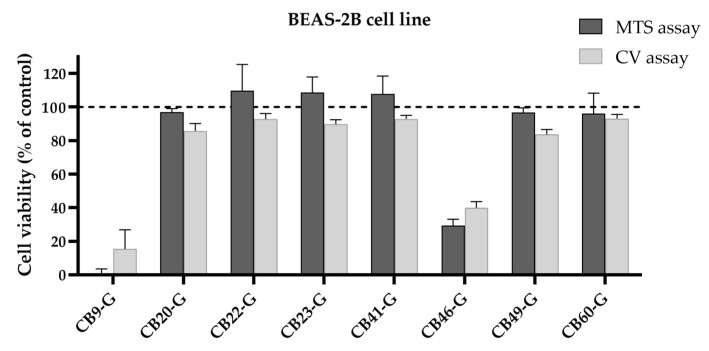
Figure 13.
Cytotoxicity of the 8 best inhibitors in BEAS-2B cells. Cell viability was assessed in the BEAS-2B cell line using the MTS reduction and the CV staining assays by incubating each compound for 72 h (CB9-G, CB20-20, CB22-G, CB23-G, CB41-G, CB49-G at 50 µM; CB46-G at 25 µM; CB60-G at 10 µM). Values represent mean ± SD and are expressed as percentages of the solvent-treated control cells considered as 100% of cell viability, identified as the dashed line in the graph (n = 2–3).

