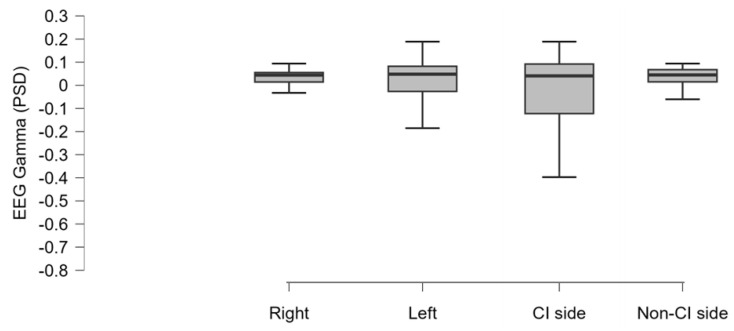
Figure 3.
The boxplot represents the mean EEG gamma activity (PSD: power spectral density) estimated in the UCI group and resulting from the averaging of the signal acquired from the electrodes located in each hemisphere (right, left. CI side, non-CI side), as specified in the Methods section. No statistically significant differences were evidenced.

