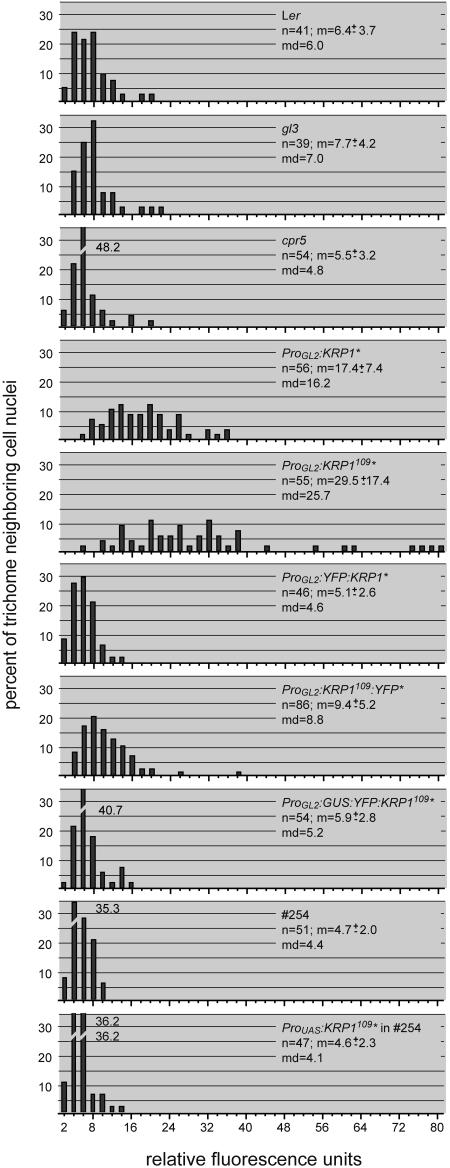
Figure 2.
Analysis of DNA Content.
Distributions of trichome-neighboring cell DNA contents are given in relative fluorescence units. Relative fluorescence units are calibrated with the fluorescence of guard cell nuclei of the analyzed leaves so that two relative fluorescence units represent ∼2C. The sample size (n), the mean (m) ± standard deviation, and the median (md) are given. ICK1/KRP1 is abbreviated as KRP1 and is marked by an asterisk.

